
- Start >
- Rivers >
- Discharge >
- Unterer Main >
- Steinbach >
- Chart of total period

Chart of total period Steinbach / Main
Discharge from 01.11.1964 to 08.04.2024
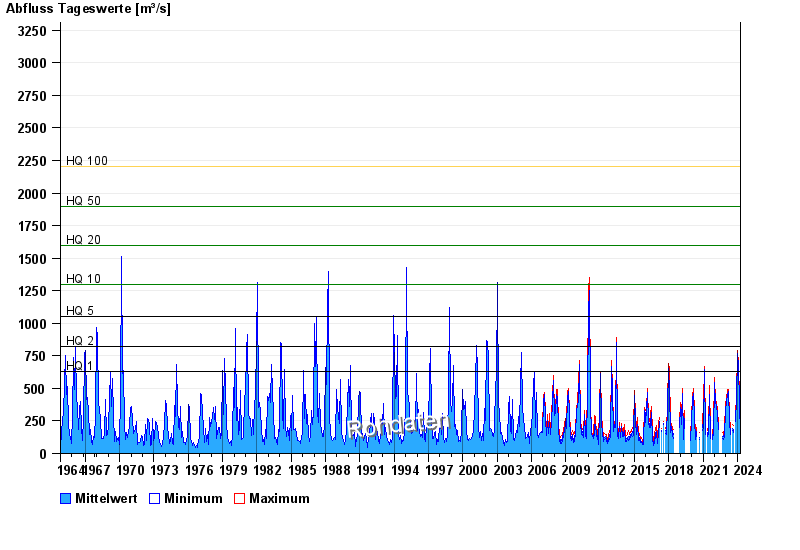
- HQ1 630 m³/s
- HQ2 820 m³/s
- HQ5 1050 m³/s
- HQ10 1300 m³/s
- HQ20 1600 m³/s
- HQ50 1900 m³/s
- HQ100 2200 m³/s
| Date | Mean value [m³/s] | Maximum [m³/s] | Minimum [m³/s] |
|---|---|---|---|
| 08.04.2024 | 132 | 161 | 106 |
| 07.04.2024 | 162 | 200 | 124 |
| 06.04.2024 | 176 | 217 | 151 |
| 05.04.2024 | 167 | 215 | 117 |
| 04.04.2024 | 137 | 163 | 106 |
| 03.04.2024 | 129 | 165 | 104 |
| 02.04.2024 | -- | -- | -- |
© Bayerisches Landesamt für Umwelt 2024