
- Start >
- Rivers >
- Discharge >
- Unterer Main >
- Schweinhof >
- Chart of year

Chart of year Schweinhof / Brend
Discharge from 01.01.2022 to 31.12.2022
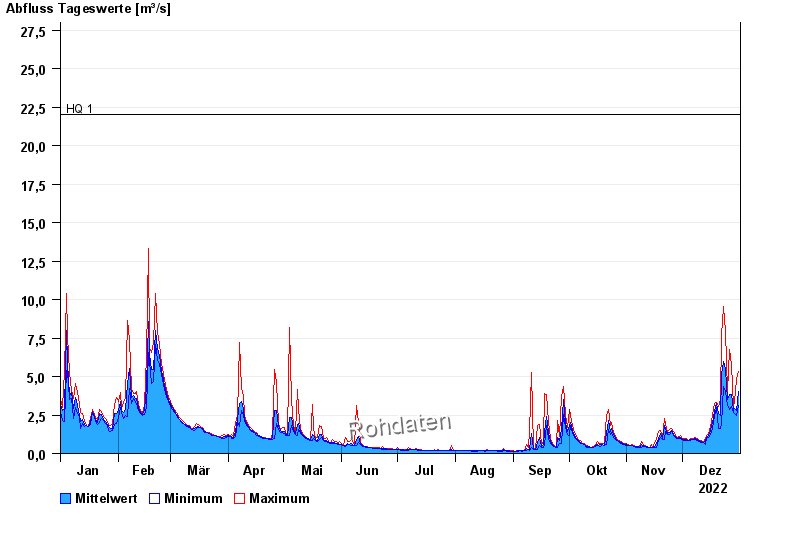
- HQ1 22 m³/s
- HQ2 30 m³/s
- HQ5 41 m³/s
- HQ10 49 m³/s
- HQ20 56 m³/s
- HQ50 65 m³/s
- HQ100 70 m³/s
| Date | Mean value [m³/s] | Maximum [m³/s] | Minimum [m³/s] |
|---|---|---|---|
| 31.12.2022 | 4.01 | 5.35 | 3.15 |
| 30.12.2022 | 2.79 | 4.82 | 2.44 |
| 29.12.2022 | 2.9 | 3.38 | 2.57 |
| 28.12.2022 | 2.81 | 3.07 | 2.64 |
| 27.12.2022 | 3.85 | 5.79 | 3.07 |
| 26.12.2022 | 3.86 | 6.75 | 2.85 |
| 25.12.2022 | 3.53 | 4.06 | 3.15 |
© Bayerisches Landesamt für Umwelt 2024