
- Start >
- Rivers >
- Discharge >
- Unterer Main >
- Schweinhof >
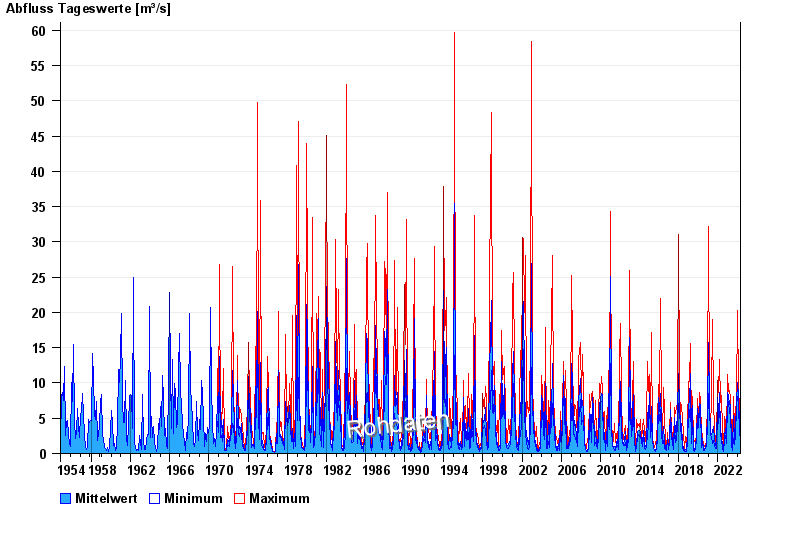
- Chart of total period

Chart of total period Schweinhof / Brend
Discharge from 01.11.1954 to 25.04.2024
| Date | Mean value [m³/s] | Maximum [m³/s] | Minimum [m³/s] |
|---|---|---|---|
| 25.04.2024 | 2.09 | 2.16 | 2.04 |
| 24.04.2024 | 2.16 | 2.28 | 2.04 |
| 23.04.2024 | 2.35 | 2.55 | 2.22 |
| 22.04.2024 | 2.75 | 3.27 | 2.55 |
| 21.04.2024 | 3.75 | 4.58 | 2.97 |
| 20.04.2024 | 3.35 | 4.39 | 2.68 |
| 19.04.2024 | 2.35 | 4.78 | 1.32 |
© Bayerisches Landesamt für Umwelt 2024