
- Start >
- Rivers >
- Discharge >
- Unterer Main >
- Sachsenheim >
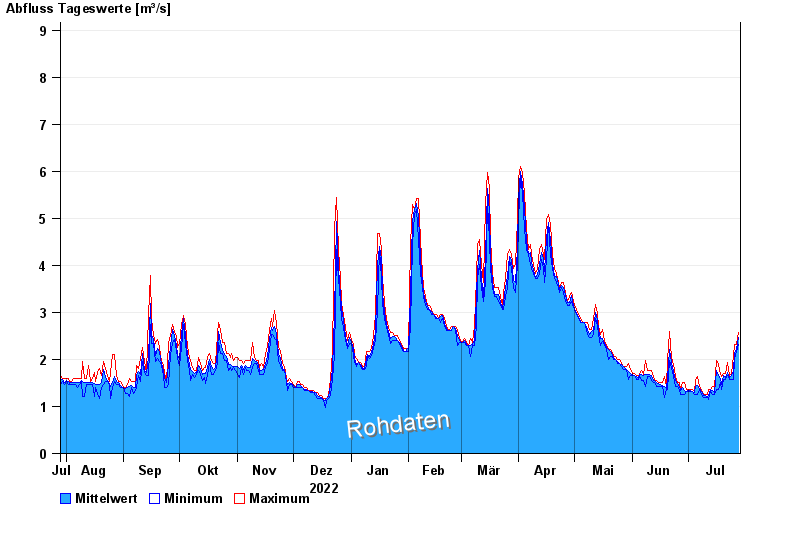
- Chart of year

Chart of year Sachsenheim / Wern
Discharge from 29.07.2022 to 28.07.2023
- 03.01.2003 Abfluss: 38,6 m³/s
- 26.01.1995 Abfluss: 37,1 m³/s
- 06.01.1982 Abfluss: 36,3 m³/s
- 08.01.2011 Abfluss: 33,9 m³/s
- 23.04.1989 Abfluss: 27,4 m³/s
| Date | Mean value [m³/s] | Maximum [m³/s] | Minimum [m³/s] |
|---|---|---|---|
| 28.07.2023 | 2.46 | 2.57 | 2.32 |
| 27.07.2023 | 2.24 | 2.32 | 2.16 |
| 26.07.2023 | 2.13 | 2.32 | 2.01 |
| 25.07.2023 | 1.76 | 2.08 | 1.58 |
| 24.07.2023 | 1.65 | 1.71 | 1.58 |
| 23.07.2023 | 1.62 | 1.65 | 1.58 |
| 22.07.2023 | 1.73 | 1.93 | 1.65 |
© Bayerisches Landesamt für Umwelt 2024