
- Start >
- Rivers >
- Discharge >
- Unterer Main >
- Sachsenheim >
- Chart of year

Chart of year Sachsenheim / Wern
Discharge from 25.07.2020 to 24.07.2021
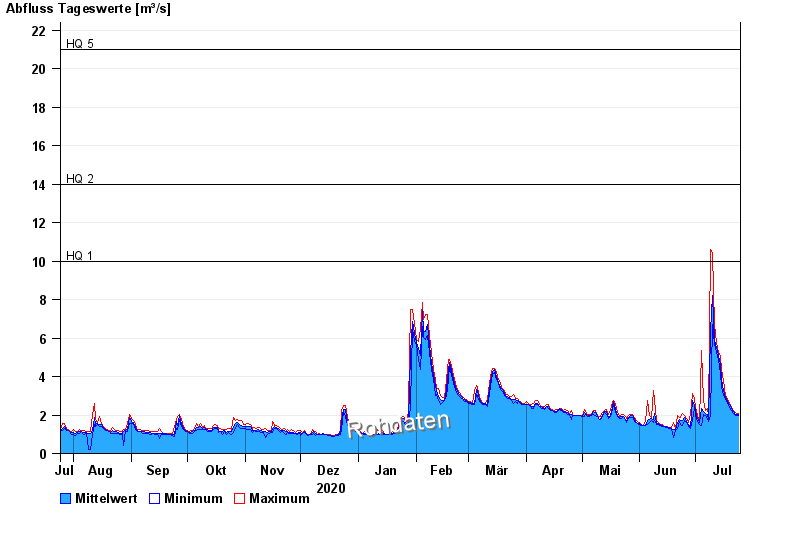
- HQ1 10 m³/s
- HQ2 14 m³/s
- HQ5 21 m³/s
- HQ10 27 m³/s
- HQ20 33 m³/s
- HQ50 44 m³/s
- HQ100 53 m³/s
| Date | Mean value [m³/s] | Maximum [m³/s] | Minimum [m³/s] |
|---|---|---|---|
| 24.07.2021 | 2.01 | 2.1 | 1.95 |
| 23.07.2021 | 2.01 | 2.1 | 1.95 |
| 22.07.2021 | 2.09 | 2.17 | 2.02 |
| 21.07.2021 | 2.2 | 2.25 | 2.1 |
| 20.07.2021 | 2.34 | 2.41 | 2.25 |
| 19.07.2021 | 2.53 | 2.58 | 2.41 |
| 18.07.2021 | 2.68 | 2.84 | 2.58 |
© Bayerisches Landesamt für Umwelt 2024