
- Start >
- Rivers >
- Discharge >
- Unterer Main >
- Sachsenheim >
- Chart of year

Chart of year Sachsenheim / Wern
Discharge from 01.01.2021 to 31.12.2021
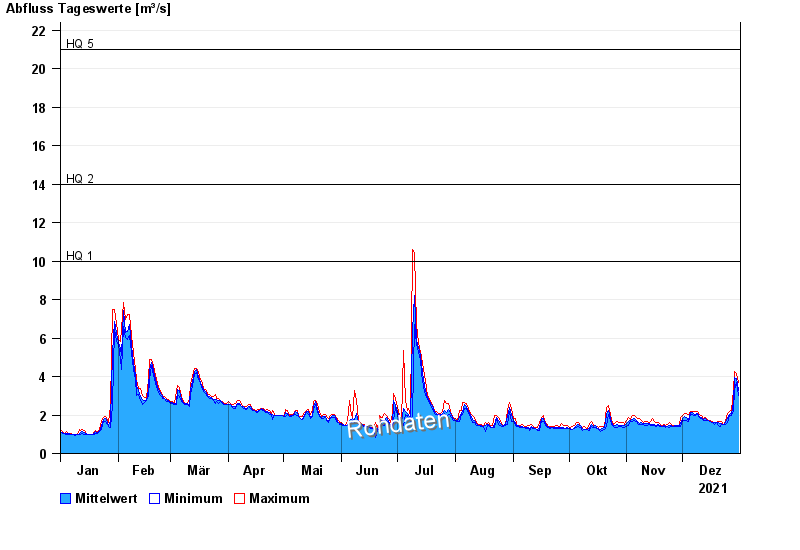
- HQ1 10 m³/s
- HQ2 14 m³/s
- HQ5 21 m³/s
- HQ10 27 m³/s
- HQ20 33 m³/s
- HQ50 44 m³/s
- HQ100 53 m³/s
| Date | Mean value [m³/s] | Maximum [m³/s] | Minimum [m³/s] |
|---|---|---|---|
| 31.12.2021 | 3.3 | 3.68 | 3.01 |
| 30.12.2021 | 3.92 | 4.18 | 3.68 |
| 29.12.2021 | 3.95 | 4.27 | 3.29 |
| 28.12.2021 | 2.64 | 3.29 | 2.25 |
| 27.12.2021 | 2.1 | 2.25 | 1.95 |
| 26.12.2021 | 2.03 | 2.17 | 1.95 |
| 25.12.2021 | 1.81 | 2.1 | 1.6 |
© Bayerisches Landesamt für Umwelt 2024