
- Start >
- Rivers >
- Discharge >
- Unterer Main >
- Rappoldshofen >
- Chart of total period

Chart of total period Rappoldshofen / Aisch
Discharge from 01.11.1968 to 25.04.2024
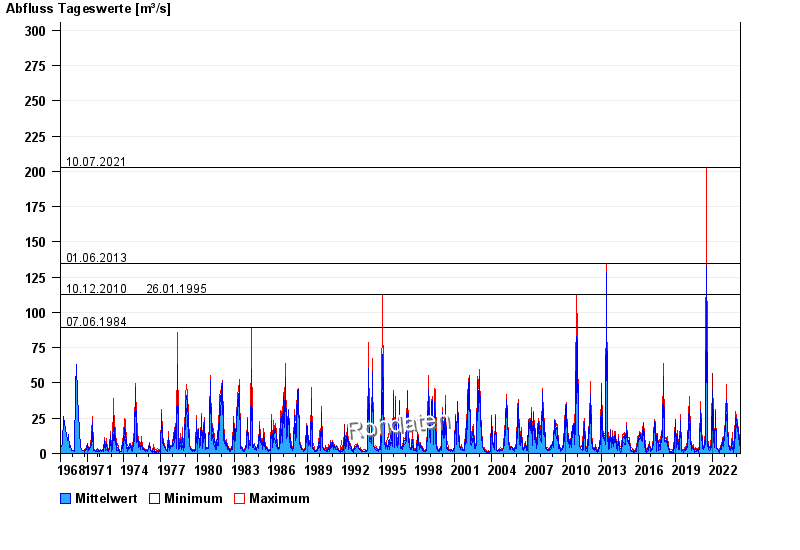
- 10.07.2021 Abfluss: 203 m³/s
- 01.06.2013 Abfluss: 135 m³/s
- 10.12.2010 Abfluss: 113 m³/s
- 26.01.1995 Abfluss: 113 m³/s
- 07.06.1984 Abfluss: 89 m³/s
| Date | Mean value [m³/s] | Maximum [m³/s] | Minimum [m³/s] |
|---|---|---|---|
| 25.04.2024 | 3.67 | 3.73 | 3.6 |
| 24.04.2024 | 3.89 | 4.14 | 3.73 |
| 23.04.2024 | 4.71 | 5.65 | 3.87 |
| 22.04.2024 | 7.07 | 8.28 | 5.65 |
| 21.04.2024 | 5.95 | 8.4 | 4.55 |
| 20.04.2024 | 5.62 | 6.19 | 4.69 |
| 19.04.2024 | 3.81 | 5.38 | 3.33 |
© Bayerisches Landesamt für Umwelt 2024