
- Start >
- Rivers >
- Discharge >
- Unterer Main >
- Poppenlauer >
- Chart of year

Chart of year Poppenlauer / Lauer
Discharge from 01.01.2024 to 23.04.2024
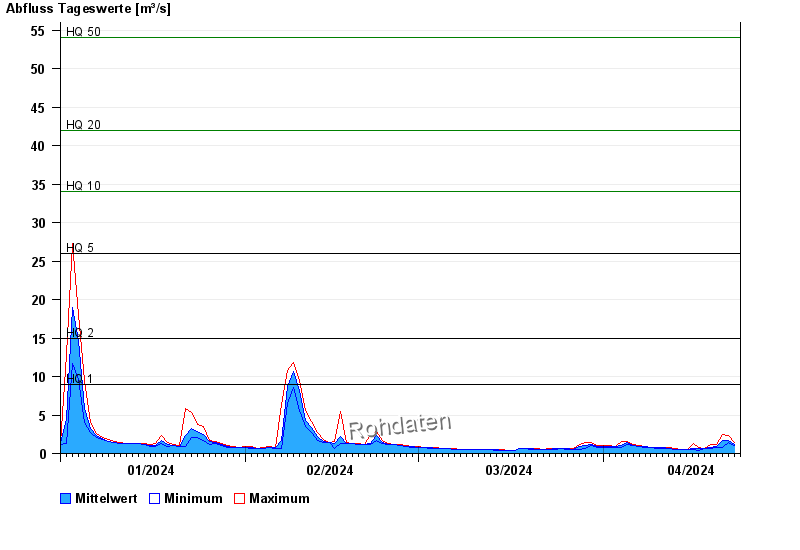
- HQ1 9 m³/s
- HQ2 15 m³/s
- HQ5 26 m³/s
- HQ10 34 m³/s
- HQ20 42 m³/s
- HQ50 54 m³/s
- HQ100 63 m³/s
| Date | Mean value [m³/s] | Maximum [m³/s] | Minimum [m³/s] |
|---|---|---|---|
| 23.04.2024 | 1.26 | 1.46 | 1.18 |
| 22.04.2024 | 1.71 | 2.32 | 1.46 |
| 21.04.2024 | 1.66 | 2.42 | 0.84 |
| 20.04.2024 | 0.952 | 1.12 | 0.791 |
| 19.04.2024 | 0.749 | 1.18 | 0.654 |
| 18.04.2024 | 0.669 | 0.699 | 0.654 |
| 17.04.2024 | 0.654 | 0.742 | 0.352 |
© Bayerisches Landesamt für Umwelt 2024