
- Start >
- Rivers >
- Discharge >
- Unterer Main >
- Pfarrweisach >
- Chart of year

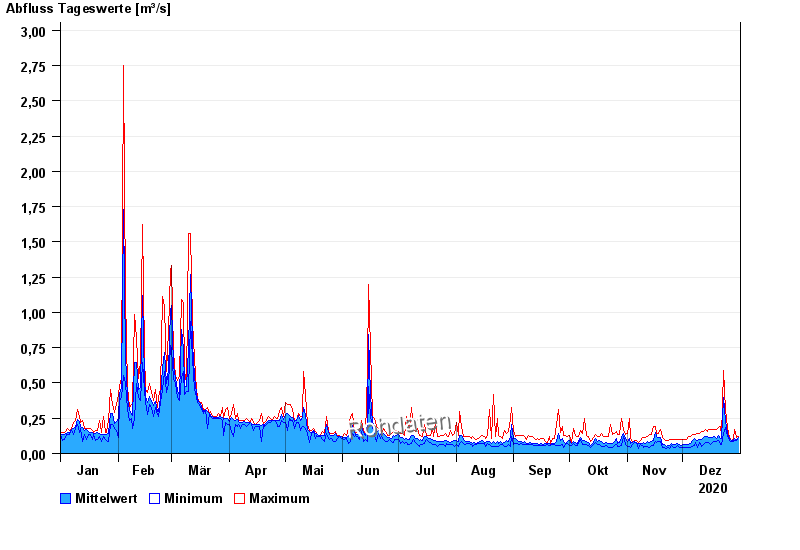
Chart of year Pfarrweisach / Weisach
Discharge from 01.01.2020 to 31.12.2020
| Date | Mean value [m³/s] | Maximum [m³/s] | Minimum [m³/s] |
|---|---|---|---|
| 31.12.2020 | 0.116 | 0.122 | 0.111 |
| 30.12.2020 | 0.096 | 0.111 | 0.092 |
| 29.12.2020 | 0.105 | 0.168 | 0.092 |
| 28.12.2020 | 0.095 | 0.102 | 0.083 |
| 27.12.2020 | 0.089 | 0.092 | 0.083 |
| 26.12.2020 | 0.103 | 0.111 | 0.092 |
| 25.12.2020 | 0.145 | 0.181 | 0.122 |
© Bayerisches Landesamt für Umwelt 2024