
- Start >
- Rivers >
- Discharge >
- Unterer Main >
- Pfarrweisach >
- Chart of year

Chart of year Pfarrweisach / Weisach
Discharge from 01.01.2018 to 31.12.2018
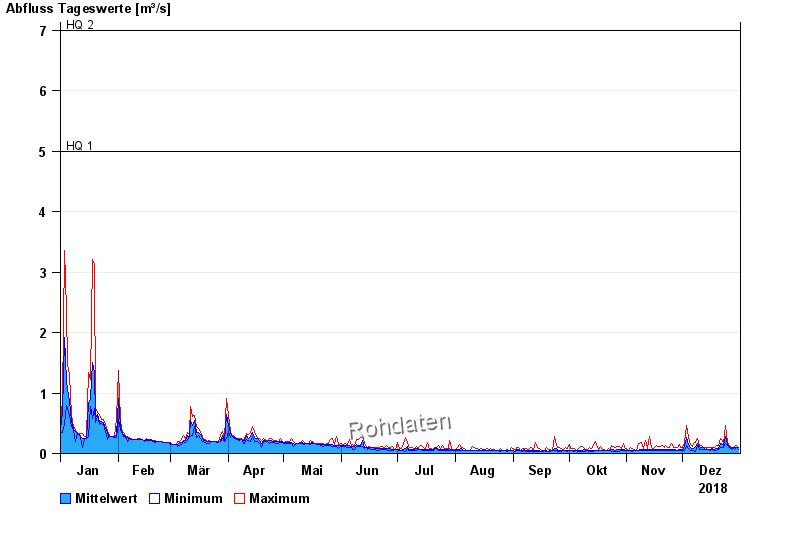
- HQ1 5 m³/s
- HQ2 7 m³/s
- HQ5 9 m³/s
- HQ10 11,5 m³/s
- HQ20 14,5 m³/s
- HQ50 18 m³/s
- HQ100 22 m³/s
| Date | Mean value [m³/s] | Maximum [m³/s] | Minimum [m³/s] |
|---|---|---|---|
| 31.12.2018 | 0.091 | 0.105 | 0.061 |
| 30.12.2018 | 0.106 | 0.126 | 0.095 |
| 29.12.2018 | 0.095 | 0.116 | 0.069 |
| 28.12.2018 | 0.096 | 0.105 | 0.086 |
| 27.12.2018 | 0.09 | 0.105 | 0.061 |
| 26.12.2018 | 0.11 | 0.126 | 0.105 |
| 25.12.2018 | 0.149 | 0.186 | 0.126 |
© Bayerisches Landesamt für Umwelt 2024