
- Start >
- Rivers >
- Discharge >
- Unterer Main >
- Pfarrweisach >
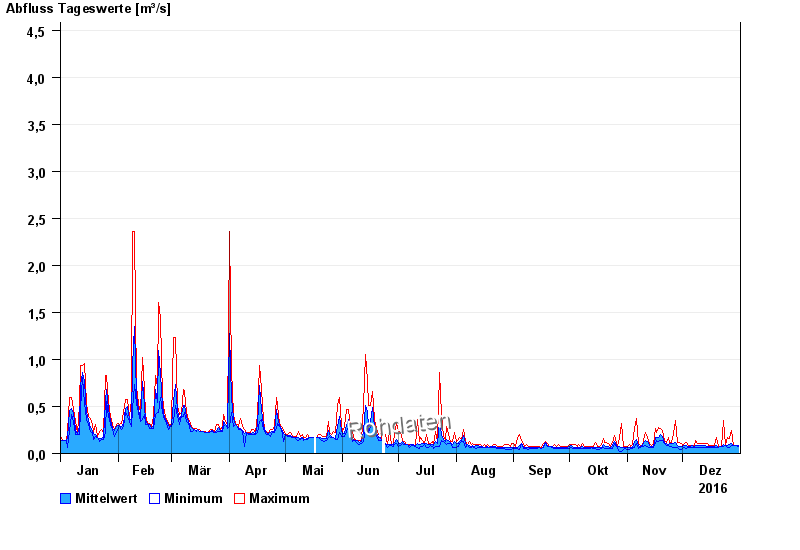
- Chart of year

Chart of year Pfarrweisach / Weisach
Discharge from 01.01.2016 to 31.12.2016
- HQ1 5 m³/s
- HQ2 7 m³/s
- HQ5 9 m³/s
- HQ10 11,5 m³/s
- HQ20 14,5 m³/s
- HQ50 18 m³/s
- HQ100 22 m³/s
| Date | Mean value [m³/s] | Maximum [m³/s] | Minimum [m³/s] |
|---|---|---|---|
| 31.12.2016 | 0.089 | 0.09 | 0.079 |
| 30.12.2016 | 0.09 | 0.09 | 0.09 |
| 29.12.2016 | 0.09 | 0.09 | 0.09 |
| 28.12.2016 | 0.09 | 0.09 | 0.09 |
| 27.12.2016 | 0.108 | 0.245 | 0.09 |
| 26.12.2016 | 0.096 | 0.158 | 0.06 |
| 25.12.2016 | 0.089 | 0.174 | 0.06 |
© Bayerisches Landesamt für Umwelt 2024