
- Start >
- Rivers >
- Discharge >
- Unterer Main >
- Pfarrweisach >
- Chart of year

Chart of year Pfarrweisach / Weisach
Discharge from 28.05.2020 to 27.05.2021
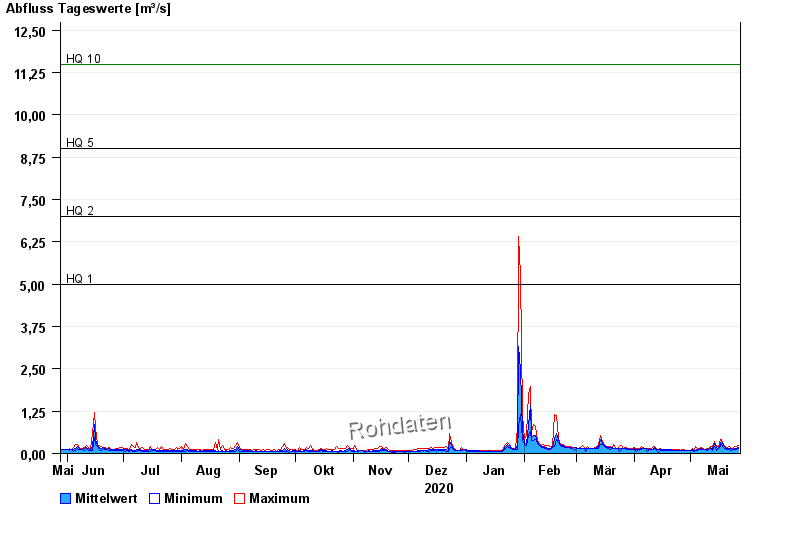
- HQ1 5 m³/s
- HQ2 7 m³/s
- HQ5 9 m³/s
- HQ10 11,5 m³/s
- HQ20 14,5 m³/s
- HQ50 18 m³/s
- HQ100 22 m³/s
| Date | Mean value [m³/s] | Maximum [m³/s] | Minimum [m³/s] |
|---|---|---|---|
| 27.05.2021 | 0.178 | 0.229 | 0.151 |
| 26.05.2021 | 0.141 | 0.201 | 0.128 |
| 25.05.2021 | 0.143 | 0.201 | 0.128 |
| 24.05.2021 | 0.123 | 0.133 | 0.122 |
| 23.05.2021 | 0.133 | 0.155 | 0.083 |
| 22.05.2021 | 0.161 | 0.206 | 0.122 |
| 21.05.2021 | 0.146 | 0.181 | 0.122 |
© Bayerisches Landesamt für Umwelt 2024