
- Start >
- Rivers >
- Discharge >
- Unterer Main >
- Pfarrweisach >
- Chart of year

Chart of year Pfarrweisach / Weisach
Discharge from 01.01.2024 to 19.04.2024
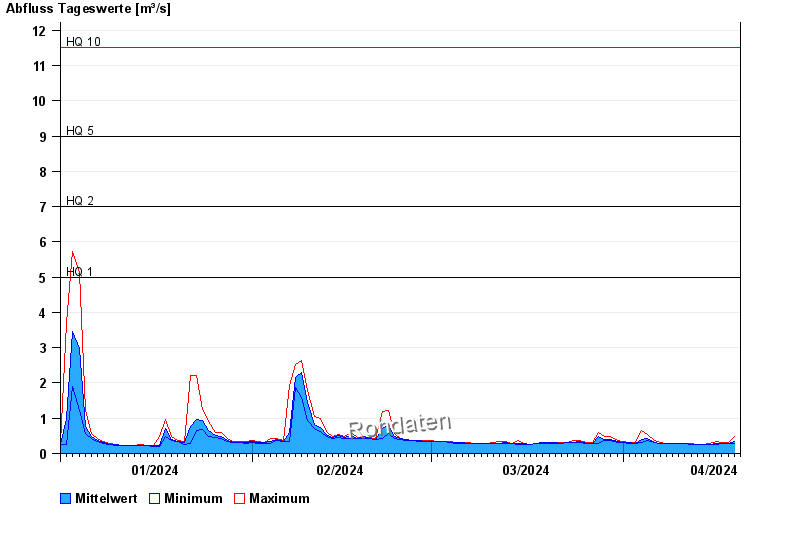
- HQ1 5 m³/s
- HQ2 7 m³/s
- HQ5 9 m³/s
- HQ10 11,5 m³/s
- HQ20 14,5 m³/s
- HQ50 18 m³/s
- HQ100 22 m³/s
| Date | Mean value [m³/s] | Maximum [m³/s] | Minimum [m³/s] |
|---|---|---|---|
| 19.04.2024 | 0.273 | 0.289 | 0.272 |
| 18.04.2024 | 0.292 | 0.305 | 0.272 |
| 17.04.2024 | 0.278 | 0.305 | 0.272 |
| 16.04.2024 | 0.277 | 0.339 | 0.241 |
| 15.04.2024 | 0.257 | 0.289 | 0.256 |
| 14.04.2024 | 0.256 | 0.256 | 0.256 |
| 13.04.2024 | 0.256 | 0.256 | 0.256 |
© Bayerisches Landesamt für Umwelt 2024