
- Start >
- Rivers >
- Discharge >
- Unterer Main >
- Oberthulba >
- Chart of total period

Chart of total period Oberthulba / Thulba
Discharge from 01.11.1981 to 24.04.2024
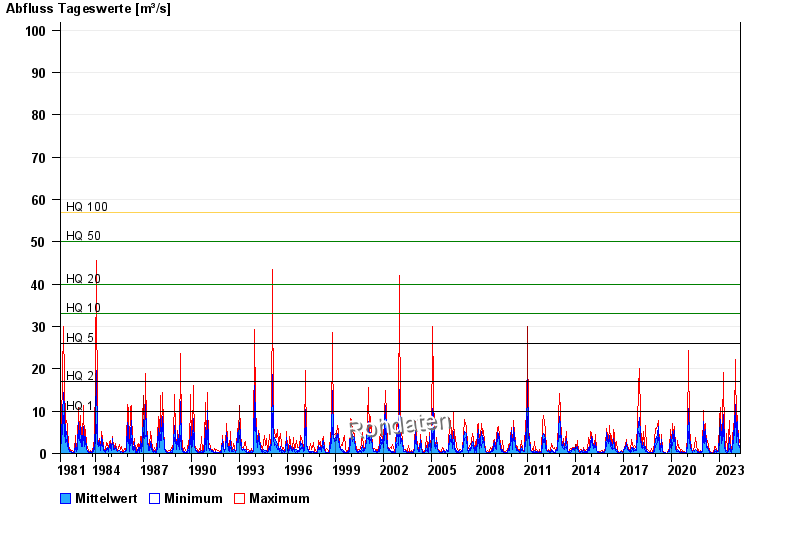
- HQ1 10 m³/s
- HQ2 17 m³/s
- HQ5 26 m³/s
- HQ10 33 m³/s
- HQ20 40 m³/s
- HQ50 50 m³/s
- HQ100 57 m³/s
| Date | Mean value [m³/s] | Maximum [m³/s] | Minimum [m³/s] |
|---|---|---|---|
| 24.04.2024 | 1.34 | 1.35 | 1.3 |
| 23.04.2024 | 1.45 | 1.56 | 1.35 |
| 22.04.2024 | 1.73 | 2.02 | 1.56 |
| 21.04.2024 | 2.34 | 3.18 | 1.56 |
| 20.04.2024 | 2.32 | 3.47 | 1.56 |
| 19.04.2024 | 1.79 | 4.17 | 0.876 |
| 18.04.2024 | 1 | 1.14 | 0.834 |
© Bayerisches Landesamt für Umwelt 2024