
- Start >
- Rivers >
- Discharge >
- Unterer Main >
- Lentersdorf >
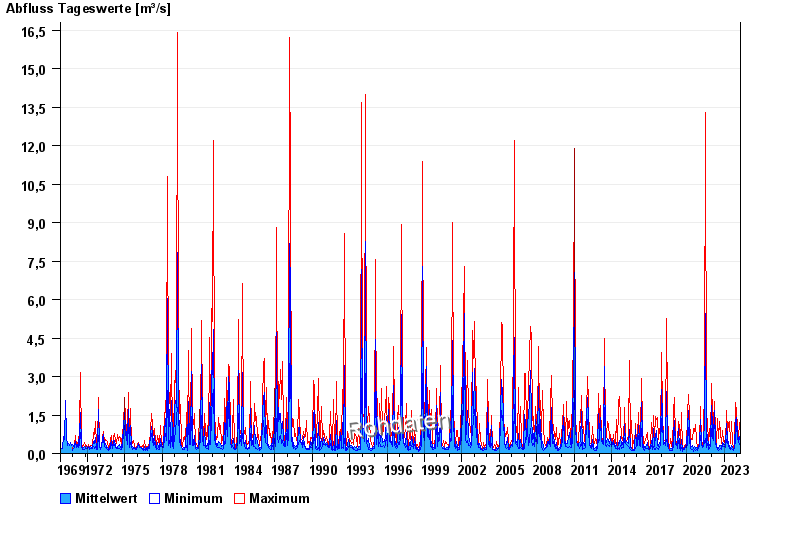
- Chart of total period

Chart of total period Lentersdorf / Bibert
Discharge from 01.11.1969 to 25.04.2024
| Date | Mean value [m³/s] | Maximum [m³/s] | Minimum [m³/s] |
|---|---|---|---|
| 25.04.2024 | 0.214 | 0.229 | 0.211 |
| 24.04.2024 | 0.232 | 0.248 | 0.229 |
| 23.04.2024 | 0.24 | 0.248 | 0.229 |
| 22.04.2024 | 0.29 | 0.337 | 0.248 |
| 21.04.2024 | 0.294 | 0.362 | 0.229 |
| 20.04.2024 | 0.332 | 0.444 | 0.268 |
| 19.04.2024 | 0.317 | 0.444 | 0.248 |
© Bayerisches Landesamt für Umwelt 2024