
- Start >
- Rivers >
- Discharge >
- Unterer Main >
- Kleinheubach >
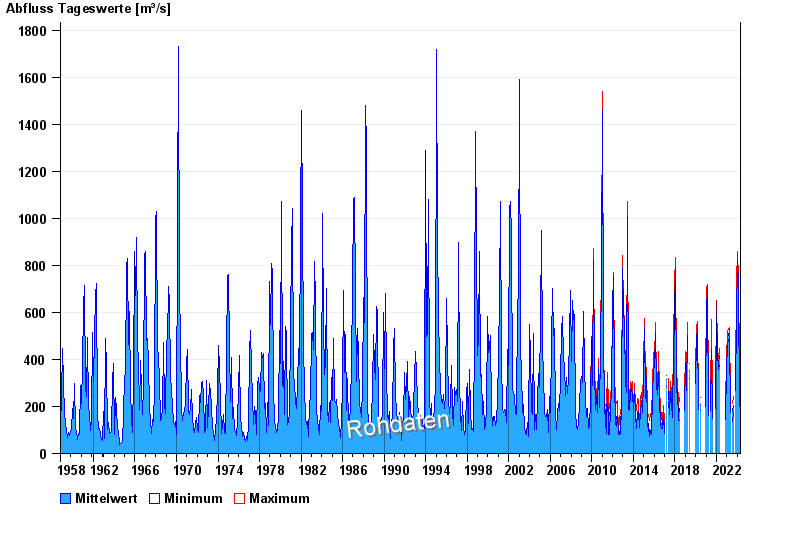
- Chart of total period

Chart of total period Kleinheubach / Main
Discharge from 01.11.1958 to 25.04.2024
| Date | Mean value [m³/s] | Maximum [m³/s] | Minimum [m³/s] |
|---|---|---|---|
| 25.04.2024 | 225 | 242 | 203 |
| 24.04.2024 | 240 | 266 | 208 |
| 23.04.2024 | 255 | 273 | 242 |
| 22.04.2024 | 262 | 282 | 246 |
| 21.04.2024 | 227 | 249 | 176 |
| 20.04.2024 | 189 | 216 | 167 |
| 19.04.2024 | -- | -- | -- |
© Bayerisches Landesamt für Umwelt 2024