
- Start >
- Rivers >
- Discharge >
- Unterer Main >
- Hafenlohr >
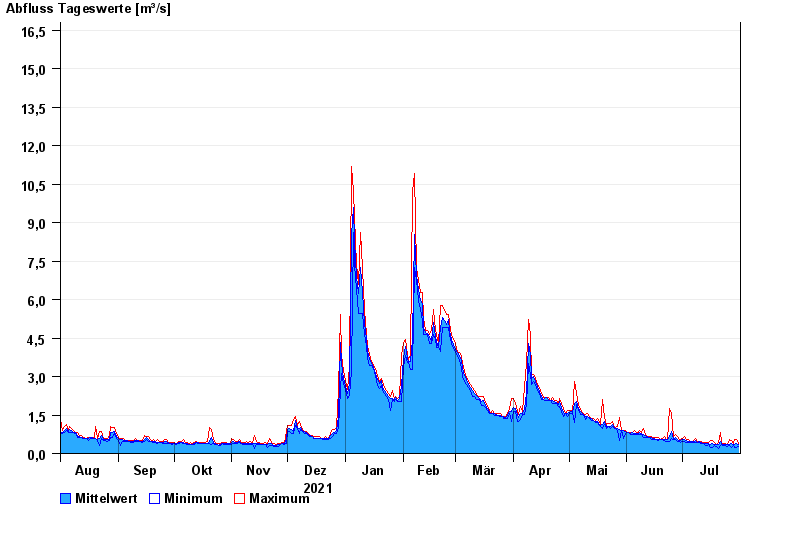
- Chart of year

Chart of year Hafenlohr / Hafenlohr
Discharge from 01.08.2021 to 31.07.2022
- 26.01.1995 Abfluss: 38,6 m³/s
- 14.01.2011 Abfluss: 34,3 m³/s
- 03.01.2003 Abfluss: 29,2 m³/s
- 21.12.1993 Abfluss: 28,6 m³/s
- 28.10.1998 Abfluss: 27,3 m³/s
| Date | Mean value [m³/s] | Maximum [m³/s] | Minimum [m³/s] |
|---|---|---|---|
| 31.07.2022 | 0.425 | 0.488 | 0.343 |
| 30.07.2022 | 0.485 | 0.658 | 0.3 |
| 29.07.2022 | 0.414 | 0.658 | 0.3 |
| 28.07.2022 | 0.427 | 0.488 | 0.389 |
| 27.07.2022 | 0.456 | 0.598 | 0.3 |
| 26.07.2022 | 0.444 | 0.658 | 0.389 |
| 25.07.2022 | 0.434 | 0.437 | 0.343 |
© Bayerisches Landesamt für Umwelt 2024