
- Start >
- Rivers >
- Discharge >
- Unterer Main >
- Hafenlohr >
- Chart of year

Chart of year Hafenlohr / Hafenlohr
Discharge from 01.08.2021 to 31.07.2022
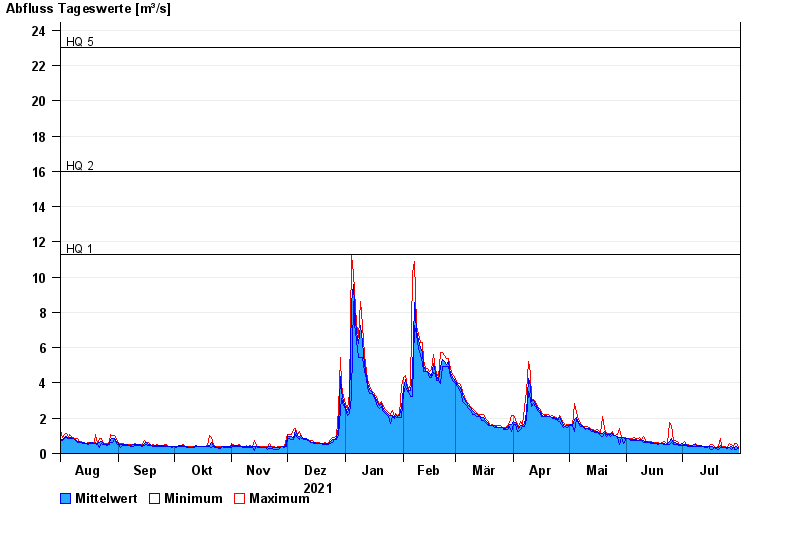
- HQ1 11,3 m³/s
- HQ2 16 m³/s
- HQ5 23 m³/s
- HQ10 28 m³/s
- HQ20 33 m³/s
- HQ50 40 m³/s
- HQ100 45 m³/s
| Date | Mean value [m³/s] | Maximum [m³/s] | Minimum [m³/s] |
|---|---|---|---|
| 31.07.2022 | 0.425 | 0.488 | 0.343 |
| 30.07.2022 | 0.485 | 0.658 | 0.3 |
| 29.07.2022 | 0.414 | 0.658 | 0.3 |
| 28.07.2022 | 0.427 | 0.488 | 0.389 |
| 27.07.2022 | 0.456 | 0.598 | 0.3 |
| 26.07.2022 | 0.444 | 0.658 | 0.389 |
| 25.07.2022 | 0.434 | 0.437 | 0.343 |
© Bayerisches Landesamt für Umwelt 2024