
- Start >
- Rivers >
- Discharge >
- Unterer Main >
- Hafenlohr >
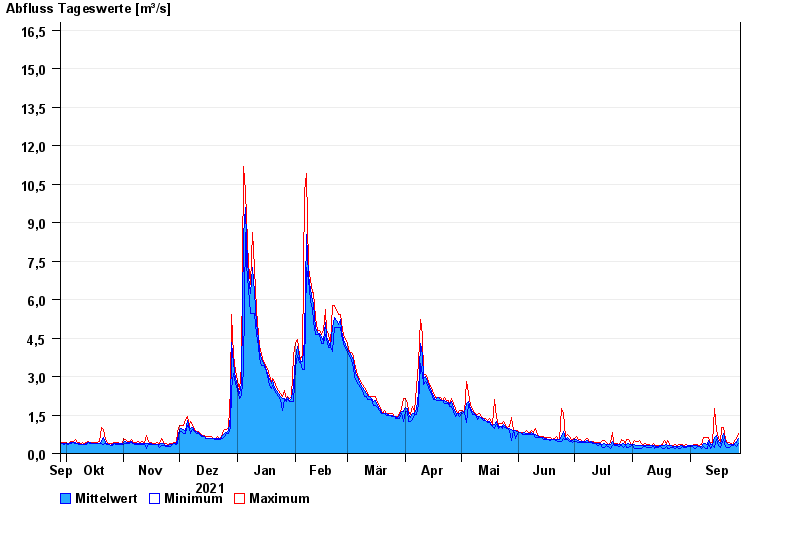
- Chart of year

Chart of year Hafenlohr / Hafenlohr
Discharge from 28.09.2021 to 27.09.2022
- 26.01.1995 Abfluss: 38,6 m³/s
- 14.01.2011 Abfluss: 34,3 m³/s
- 03.01.2003 Abfluss: 29,2 m³/s
- 21.12.1993 Abfluss: 28,6 m³/s
- 28.10.1998 Abfluss: 27,3 m³/s
| Date | Mean value [m³/s] | Maximum [m³/s] | Minimum [m³/s] |
|---|---|---|---|
| 27.09.2022 | 0.586 | 0.778 | 0.404 |
| 26.09.2022 | 0.421 | 0.604 | 0.281 |
| 25.09.2022 | 0.401 | 0.499 | 0.36 |
| 24.09.2022 | 0.349 | 0.36 | 0.32 |
| 23.09.2022 | 0.344 | 0.404 | 0.32 |
| 22.09.2022 | 0.359 | 0.45 | 0.245 |
| 21.09.2022 | 0.398 | 0.45 | 0.245 |
© Bayerisches Landesamt für Umwelt 2024