
- Start >
- Rivers >
- Discharge >
- Unterer Main >
- Hafenlohr >
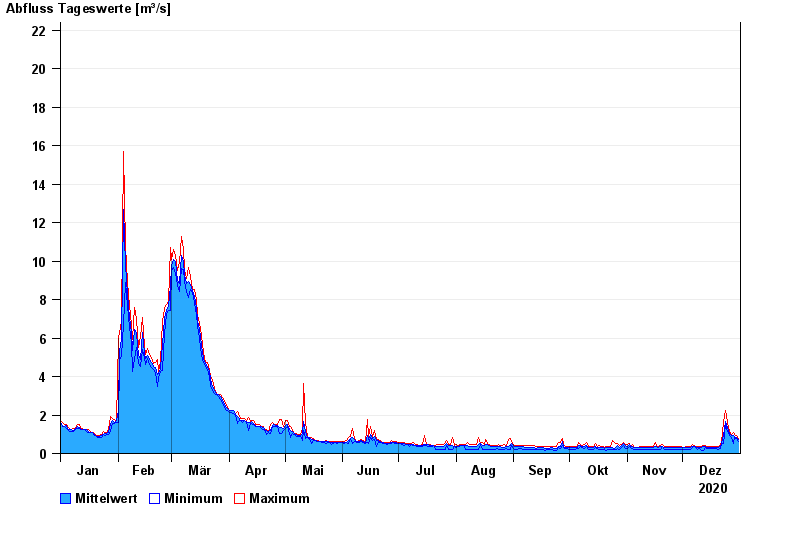
- Chart of year

Chart of year Hafenlohr / Hafenlohr
Discharge from 01.01.2020 to 31.12.2020
- 26.01.1995 Abfluss: 38,6 m³/s
- 14.01.2011 Abfluss: 34,3 m³/s
- 03.01.2003 Abfluss: 29,2 m³/s
- 21.12.1993 Abfluss: 28,6 m³/s
- 28.10.1998 Abfluss: 27,3 m³/s
| Date | Mean value [m³/s] | Maximum [m³/s] | Minimum [m³/s] |
|---|---|---|---|
| 31.12.2020 | 0.684 | 0.726 | 0.61 |
| 30.12.2020 | 0.77 | 0.851 | 0.726 |
| 29.12.2020 | 0.831 | 0.917 | 0.786 |
| 28.12.2020 | 0.853 | 0.985 | 0.504 |
| 27.12.2020 | 0.86 | 0.917 | 0.786 |
| 26.12.2020 | 0.942 | 1.06 | 0.851 |
| 25.12.2020 | 1.26 | 1.45 | 1.06 |
© Bayerisches Landesamt für Umwelt 2024