
- Start >
- Rivers >
- Discharge >
- Unterer Main >
- Hafenlohr >
- Chart of year

Chart of year Hafenlohr / Hafenlohr
Discharge from 27.01.2020 to 26.01.2021
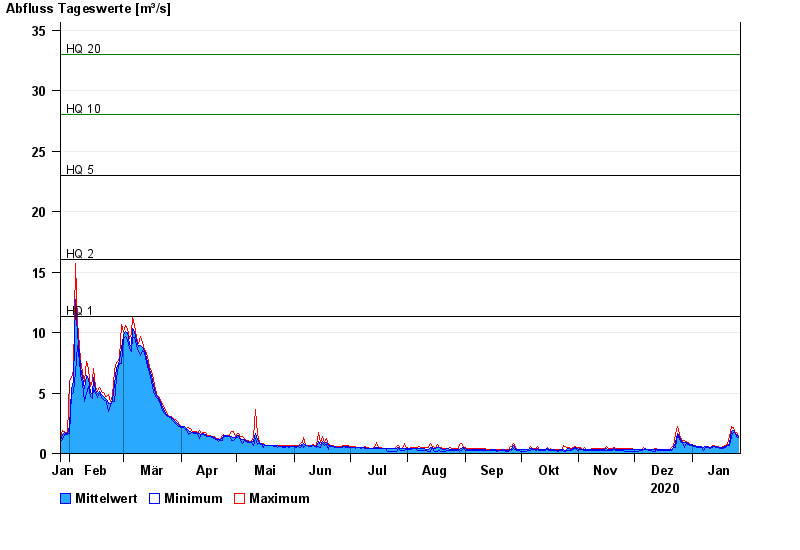
- HQ1 11,3 m³/s
- HQ2 16 m³/s
- HQ5 23 m³/s
- HQ10 28 m³/s
- HQ20 33 m³/s
- HQ50 40 m³/s
- HQ100 45 m³/s
| Date | Mean value [m³/s] | Maximum [m³/s] | Minimum [m³/s] |
|---|---|---|---|
| 26.01.2021 | 1.17 | 1.29 | 1.06 |
| 25.01.2021 | 1.32 | 1.45 | 1.13 |
| 24.01.2021 | 1.48 | 1.54 | 1.29 |
| 23.01.2021 | 1.61 | 1.82 | 1.37 |
| 22.01.2021 | 1.54 | 1.92 | 1.21 |
| 21.01.2021 | 0.738 | 1.21 | 0.556 |
| 20.01.2021 | 0.61 | 0.667 | 0.556 |
© Bayerisches Landesamt für Umwelt 2024