
- Start >
- Rivers >
- Discharge >
- Unterer Main >
- Hafenlohr >
- Chart of year

Chart of year Hafenlohr / Hafenlohr
Discharge from 11.12.2018 to 10.12.2019
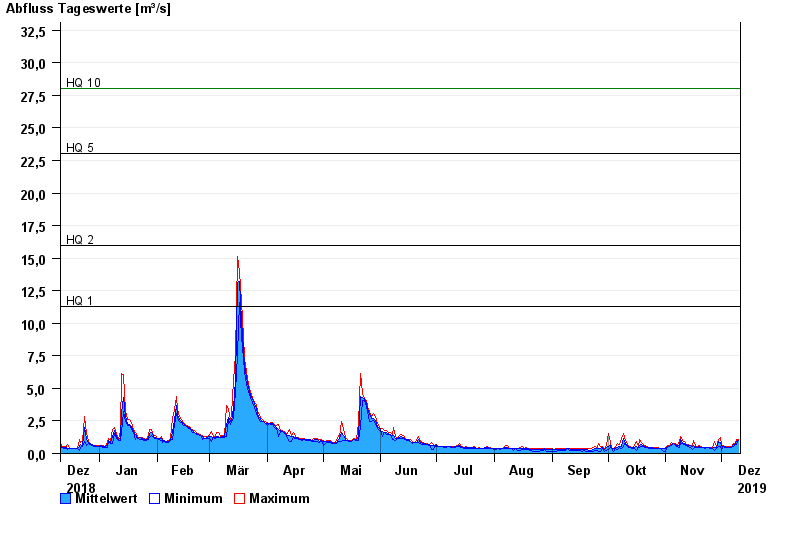
- HQ1 11,3 m³/s
- HQ2 16 m³/s
- HQ5 23 m³/s
- HQ10 28 m³/s
- HQ20 33 m³/s
- HQ50 40 m³/s
- HQ100 45 m³/s
| Date | Mean value [m³/s] | Maximum [m³/s] | Minimum [m³/s] |
|---|---|---|---|
| 10.12.2019 | 0.922 | 0.959 | 0.892 |
| 09.12.2019 | 0.803 | 0.959 | 0.648 |
| 08.12.2019 | 0.629 | 0.648 | 0.592 |
| 07.12.2019 | 0.649 | 0.705 | 0.54 |
| 06.12.2019 | 0.444 | 0.489 | 0.441 |
| 05.12.2019 | 0.446 | 0.489 | 0.441 |
| 04.12.2019 | 0.462 | 0.489 | 0.441 |
© Bayerisches Landesamt für Umwelt 2024