
- Start >
- Rivers >
- Discharge >
- Unterer Main >
- Gräfendorf >
- Chart of year

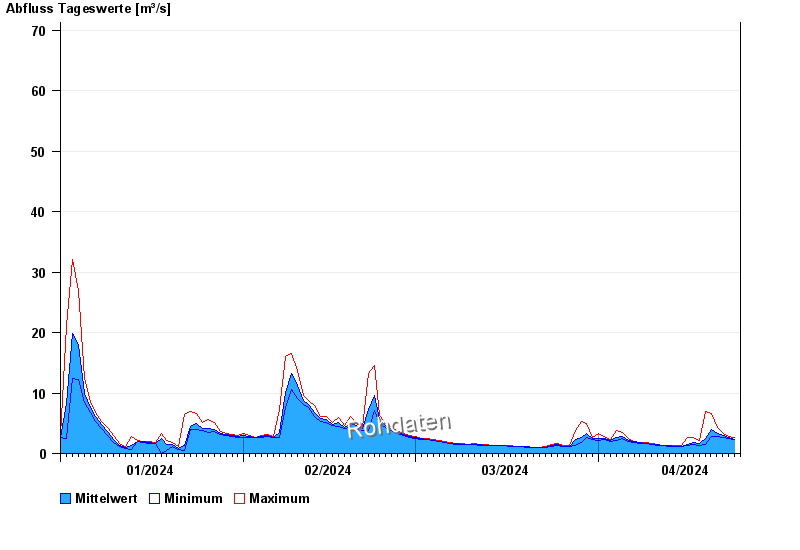
Chart of year Gräfendorf / Schondra
Discharge from 01.01.2024 to 24.04.2024
 Für diesen Pegel sind keine Jährlichkeiten hinterlegt.
| Date | Mean value [m³/s] | Maximum [m³/s] | Minimum [m³/s] |
|---|---|---|---|
| 24.04.2024 | 2.34 | 2.41 | 2.25 |
| 23.04.2024 | 2.57 | 2.85 | 2.41 |
| 22.04.2024 | 2.9 | 3.3 | 2.67 |
| 21.04.2024 | 3.33 | 4.23 | 2.76 |
| 20.04.2024 | 4.03 | 6.57 | 2.76 |
| 19.04.2024 | 2.41 | 6.89 | 1.54 |
| 18.04.2024 | 1.69 | 2.07 | 1.39 |
© Bayerisches Landesamt für Umwelt 2024