
- Start >
- Rivers >
- Discharge >
- Unterer Main >
- Gollmuthhausen >
- Chart of year

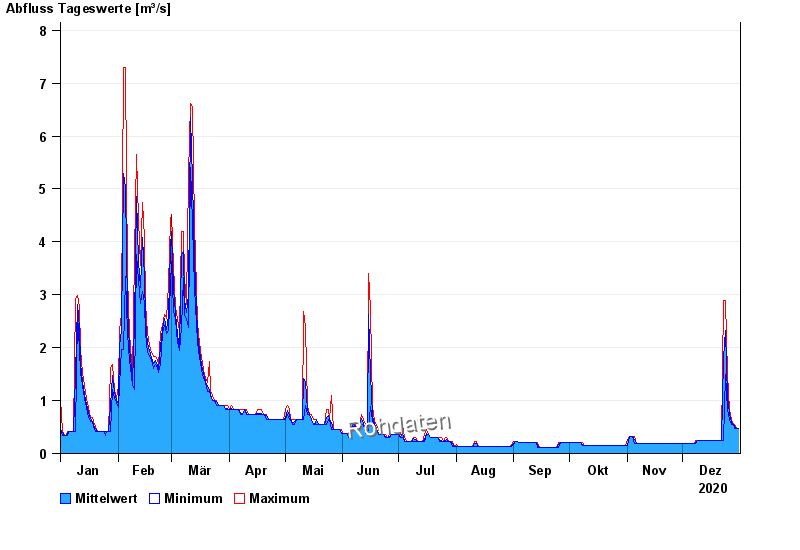
Chart of year Gollmuthhausen / Milz
Discharge from 01.01.2020 to 31.12.2020
| Date | Mean value [m³/s] | Maximum [m³/s] | Minimum [m³/s] |
|---|---|---|---|
| 31.12.2020 | 0.469 | 0.469 | 0.469 |
| 30.12.2020 | 0.469 | 0.469 | 0.469 |
| 29.12.2020 | 0.512 | 0.555 | 0.469 |
| 28.12.2020 | 0.555 | 0.555 | 0.555 |
| 27.12.2020 | 0.584 | 0.646 | 0.555 |
| 26.12.2020 | 0.754 | 0.832 | 0.646 |
| 25.12.2020 | 1.06 | 1.5 | 0.832 |
© Bayerisches Landesamt für Umwelt 2024