
- Start >
- Rivers >
- Discharge >
- Unterer Main >
- Emskirchen >
- Chart of year

Chart of year Emskirchen / Aurach
Discharge from 01.01.2020 to 31.12.2020
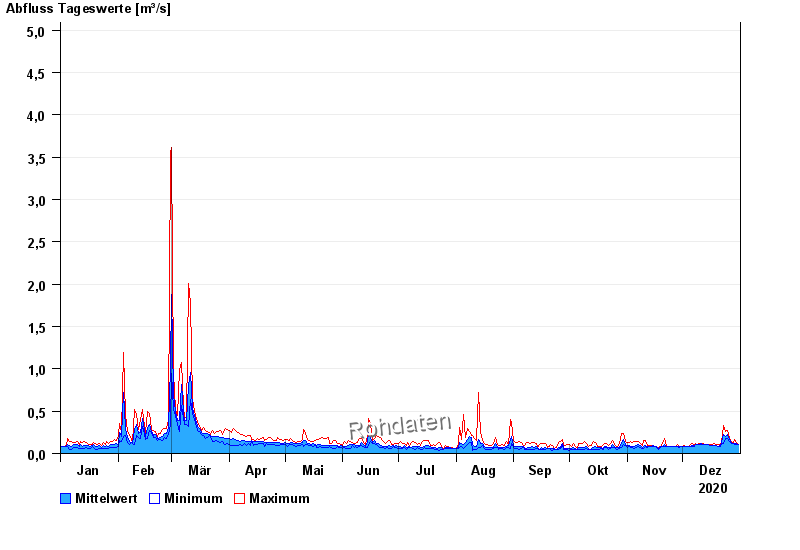
note
Wasserstand und Abfluss wird zeitweise durch Biberdamm beeinflusst.
- 21.12.1993 Abfluss: 27,7 m³/s
- 26.01.1995 Abfluss: 26,5 m³/s
- 21.03.2002 Abfluss: 26,2 m³/s
- 29.05.2007 Abfluss: 16,6 m³/s
- 02.03.1987 Abfluss: 15,4 m³/s
| Date | Mean value [m³/s] | Maximum [m³/s] | Minimum [m³/s] |
|---|---|---|---|
| 31.12.2020 | 0.102 | 0.111 | 0.101 |
| 30.12.2020 | 0.114 | 0.133 | 0.111 |
| 29.12.2020 | 0.121 | 0.163 | 0.111 |
| 28.12.2020 | 0.116 | 0.122 | 0.115 |
| 27.12.2020 | 0.131 | 0.146 | 0.122 |
| 26.12.2020 | 0.16 | 0.183 | 0.145 |
| 25.12.2020 | 0.228 | 0.266 | 0.177 |
© Bayerisches Landesamt für Umwelt 2024