
- Start >
- Rivers >
- Discharge >
- Unterer Main >
- Emskirchen >
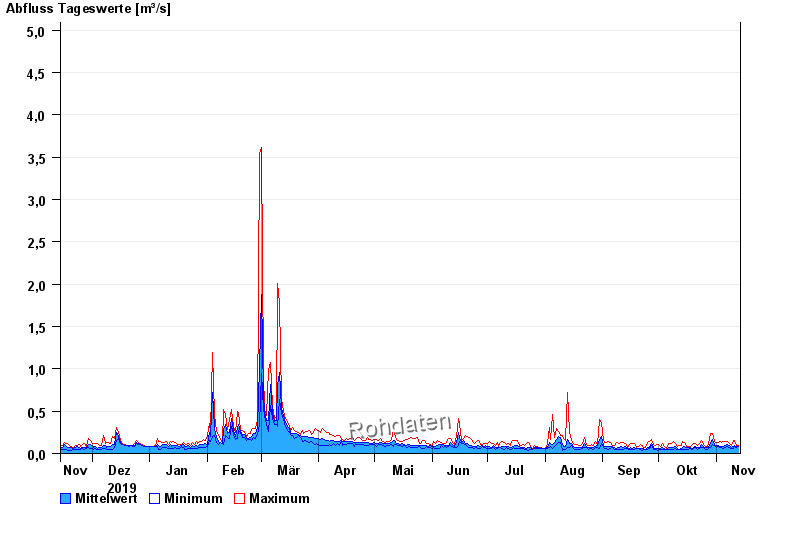
- Chart of year

Chart of year Emskirchen / Aurach
Discharge from 14.11.2019 to 13.11.2020
note
Wasserstand und Abfluss wird zeitweise durch Biberdamm beeinflusst.
- 21.12.1993 Abfluss: 27,7 m³/s
- 26.01.1995 Abfluss: 26,5 m³/s
- 21.03.2002 Abfluss: 26,2 m³/s
- 29.05.2007 Abfluss: 16,6 m³/s
- 02.03.1987 Abfluss: 15,4 m³/s
| Date | Mean value [m³/s] | Maximum [m³/s] | Minimum [m³/s] |
|---|---|---|---|
| 13.11.2020 | 0.086 | 0.1 | 0.078 |
| 12.11.2020 | 0.078 | 0.099 | 0.073 |
| 11.11.2020 | 0.092 | 0.156 | 0.081 |
| 10.11.2020 | 0.078 | 0.159 | 0.061 |
| 09.11.2020 | 0.073 | 0.094 | 0.061 |
| 08.11.2020 | 0.093 | 0.122 | 0.072 |
| 07.11.2020 | 0.105 | 0.138 | 0.079 |
© Bayerisches Landesamt für Umwelt 2024