
- Start >
- Rivers >
- Discharge >
- Unterer Main >
- Bürgstadt >
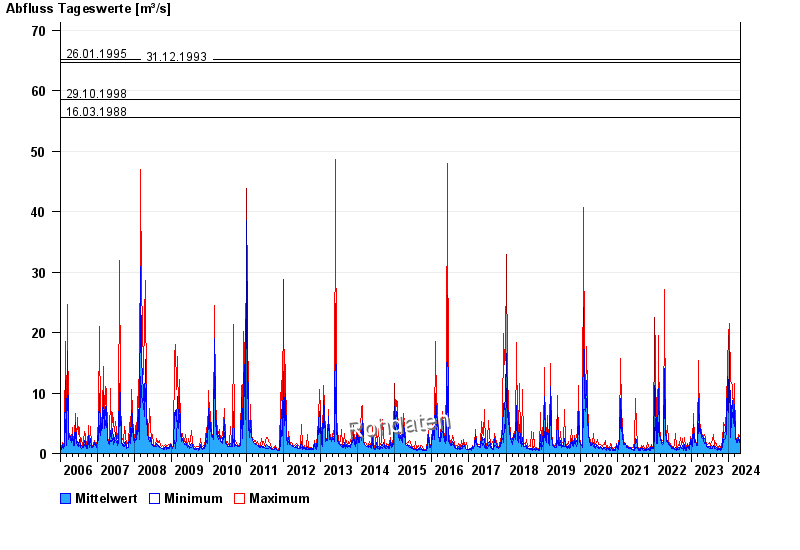
- Chart of total period

Chart of total period Bürgstadt / Erf
Discharge from 01.01.2006 to 24.04.2024
- 23.05.1978 Abfluss: 84,1 m³/s
- 26.01.1995 Abfluss: 65,2 m³/s
- 31.12.1993 Abfluss: 64,6 m³/s
- 29.10.1998 Abfluss: 58,5 m³/s
- 16.03.1988 Abfluss: 55,5 m³/s
| Date | Mean value [m³/s] | Maximum [m³/s] | Minimum [m³/s] |
|---|---|---|---|
| 24.04.2024 | 1.93 | 2.02 | 1.88 |
| 23.04.2024 | 2.07 | 2.17 | 2.02 |
| 22.04.2024 | 2.46 | 2.79 | 2.17 |
| 21.04.2024 | 2.04 | 2.63 | 1.75 |
| 20.04.2024 | 2.15 | 2.79 | 1.75 |
| 19.04.2024 | 1.75 | 2.79 | 1.49 |
| 18.04.2024 | 1.54 | 1.75 | 1.49 |
© Bayerisches Landesamt für Umwelt 2024