
- Start >
- Rivers >
- Discharge >
- Unterer Main >
- Bockenfeld >
- Chart of year

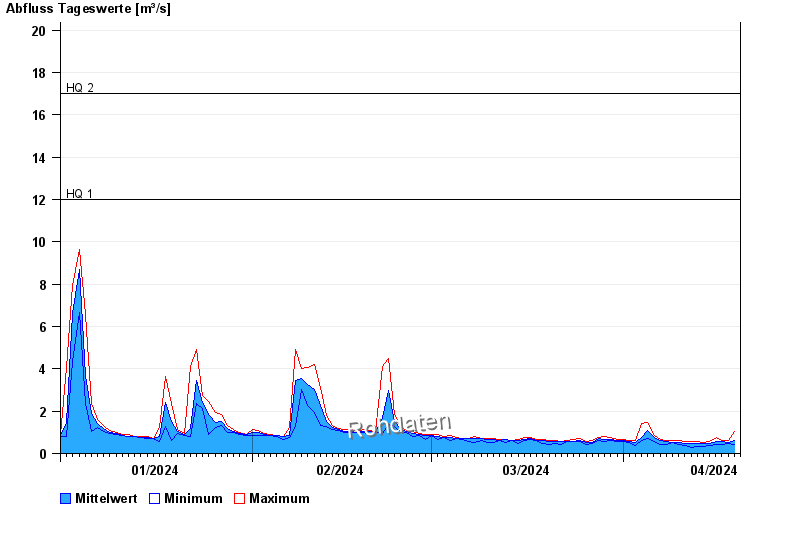
Chart of year Bockenfeld / Tauber
Discharge from 01.01.2024 to 19.04.2024
note
Wasserstand und Abfluss wird zeitweise durch Biberdamm beeinflusst.
- HQ1 12 m³/s
- HQ2 17 m³/s
- HQ5 22 m³/s
- HQ10 29 m³/s
- HQ20 35 m³/s
- HQ50 44 m³/s
- HQ100 54 m³/s
| Date | Mean value [m³/s] | Maximum [m³/s] | Minimum [m³/s] |
|---|---|---|---|
| 19.04.2024 | 0.47 | 0.47 | 0.47 |
| 18.04.2024 | 0.525 | 0.597 | 0.47 |
| 17.04.2024 | 0.549 | 0.623 | 0.424 |
| 16.04.2024 | 0.556 | 0.757 | 0.424 |
| 15.04.2024 | 0.467 | 0.57 | 0.378 |
| 14.04.2024 | 0.452 | 0.519 | 0.336 |
| 13.04.2024 | 0.459 | 0.545 | 0.315 |
© Bayerisches Landesamt für Umwelt 2024