
- Start >
- Rivers >
- Discharge >
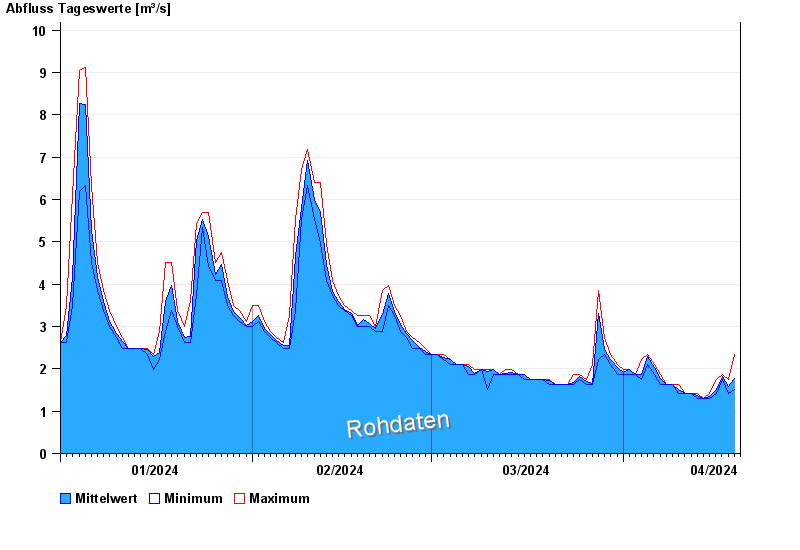
- Unterer Main >
- Birkenfeld >
- Chart of year

Chart of year Birkenfeld / Aisch
Discharge from 01.01.2024 to 19.04.2024
| Date | Mean value [m³/s] | Maximum [m³/s] | Minimum [m³/s] |
|---|---|---|---|
| 19.04.2024 | 1.72 | 2.35 | 1.52 |
| 18.04.2024 | 1.59 | 1.75 | 1.42 |
| 17.04.2024 | 1.83 | 1.87 | 1.75 |
| 16.04.2024 | 1.51 | 1.75 | 1.42 |
| 15.04.2024 | 1.34 | 1.42 | 1.31 |
| 14.04.2024 | 1.31 | 1.31 | 1.31 |
| 13.04.2024 | 1.36 | 1.42 | 1.31 |
© Bayerisches Landesamt für Umwelt 2024