
- Start >
- Rivers >
- Discharge >
- Unterer Main >
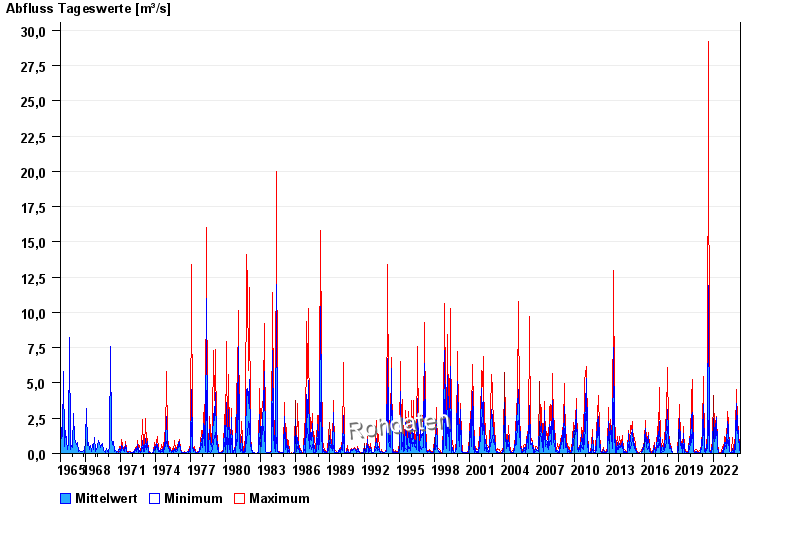
- Binzwangen >
- Chart of total period

Chart of total period Binzwangen / Altmühl
Discharge from 01.11.1965 to 16.04.2024
note
Wasserstand und Abfluss wird zeitweise durch Biberdamm beeinflusst.
| Date | Mean value [m³/s] | Maximum [m³/s] | Minimum [m³/s] |
|---|---|---|---|
| 16.04.2024 | 0.062 | 0.074 | 0.059 |
| 15.04.2024 | 0.059 | 0.059 | 0.059 |
| 14.04.2024 | 0.066 | 0.067 | 0.059 |
| 13.04.2024 | 0.054 | 0.059 | 0.047 |
| 12.04.2024 | 0.049 | 0.053 | 0.047 |
| 11.04.2024 | 0.054 | 0.059 | 0.053 |
| 10.04.2024 | 0.06 | 0.074 | 0.059 |
© Bayerisches Landesamt für Umwelt 2024