
- Start >
- Rivers >
- Discharge >
- Unterer Main >
- Bieberehren >
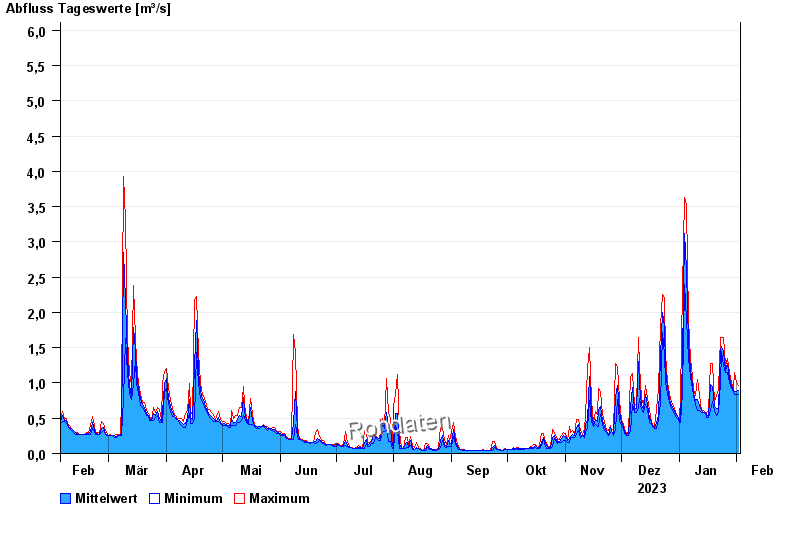
- Chart of year

Chart of year Bieberehren / Gollach
Discharge from 03.02.2023 to 02.02.2024
- 01.06.2013 Abfluss: 36,8 m³/s
- 26.01.1995 Abfluss: 23,4 m³/s
- 10.06.1965 Abfluss: 23 m³/s
- 22.02.1970 Abfluss: 22,2 m³/s
- 31.01.1982 Abfluss: 20,4 m³/s
| Date | Mean value [m³/s] | Maximum [m³/s] | Minimum [m³/s] |
|---|---|---|---|
| 02.02.2024 | 0.899 | 0.965 | 0.834 |
| 01.02.2024 | 0.879 | 1.01 | 0.834 |
| 31.01.2024 | 0.884 | 1.15 | 0.834 |
| 30.01.2024 | 0.89 | 0.919 | 0.874 |
| 29.01.2024 | 0.963 | 1.01 | 0.919 |
| 28.01.2024 | 1.07 | 1.15 | 1.01 |
| 27.01.2024 | 1.27 | 1.34 | 1.15 |
© Bayerisches Landesamt für Umwelt 2024