
- Start >
- Rivers >
- Discharge >
- Unterer Main >
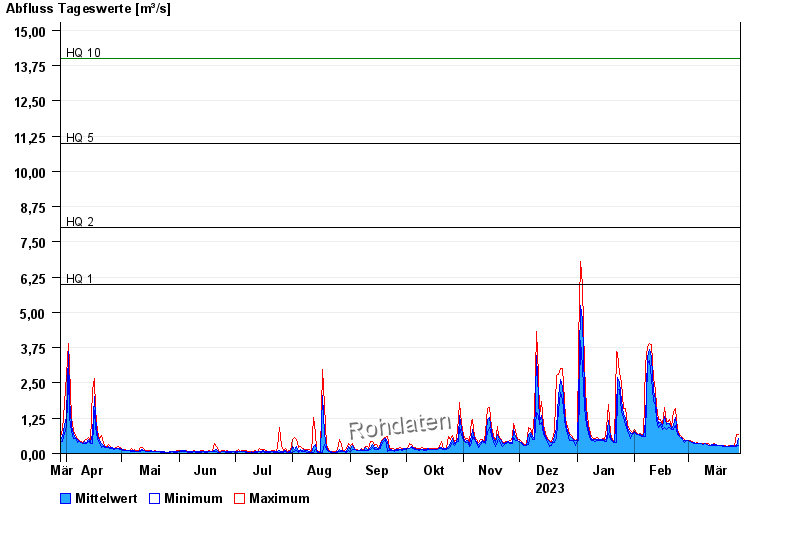
- Bad Königshofen im Grabfeld >
- Chart of year

Chart of year Bad Königshofen im Grabfeld / Fränkische Saale
Discharge from 29.03.2023 to 28.03.2024
note
Biberaktivität: Werte können durch Aufstau beeinflusst sein
- HQ1 6 m³/s
- HQ2 8 m³/s
- HQ5 11 m³/s
- HQ10 14 m³/s
- HQ20 16 m³/s
- HQ50 18 m³/s
- HQ100 22 m³/s
| Date | Mean value [m³/s] | Maximum [m³/s] | Minimum [m³/s] |
|---|---|---|---|
| 28.03.2024 | 0.523 | 0.687 | 0.299 |
| 27.03.2024 | 0.272 | 0.687 | 0.245 |
| 26.03.2024 | 0.259 | 0.299 | 0.245 |
| 25.03.2024 | 0.269 | 0.281 | 0.262 |
| 24.03.2024 | 0.273 | 0.281 | 0.262 |
| 23.03.2024 | 0.253 | 0.281 | 0.245 |
| 22.03.2024 | 0.247 | 0.262 | 0.245 |
© Bayerisches Landesamt für Umwelt 2024