
- Start >
- Rivers >
- Discharge >
- Unterer Main >
- Bad Königshofen im Grabfeld >
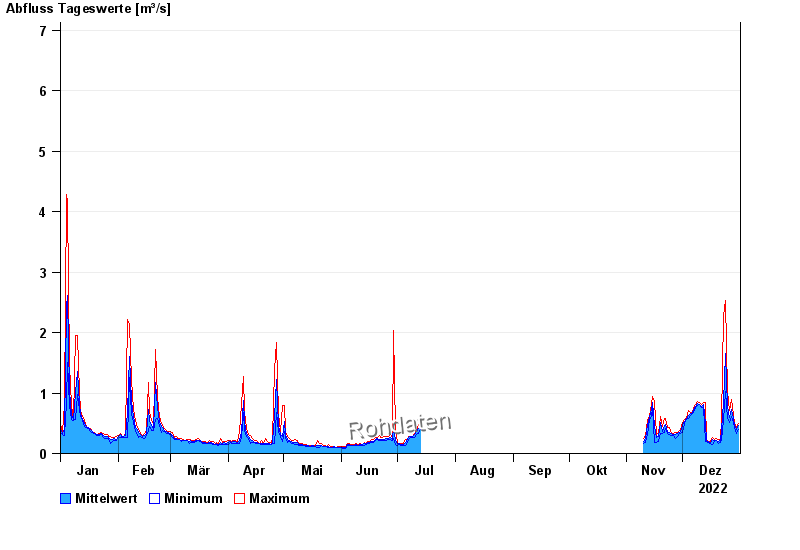
- Chart of year

Chart of year Bad Königshofen im Grabfeld / Fränkische Saale
Discharge from 01.01.2022 to 31.12.2022
note
Biberaktivität: Werte können durch Aufstau beeinflusst sein
- 07.05.1969 Abfluss: 20,9 m³/s
- 03.01.2003 Abfluss: 19,3 m³/s
- 24.12.1968 Abfluss: 16,6 m³/s
- 08.01.2011 Abfluss: 15,2 m³/s
- 23.02.1970 Abfluss: 15,1 m³/s
| Date | Mean value [m³/s] | Maximum [m³/s] | Minimum [m³/s] |
|---|---|---|---|
| 31.12.2022 | 0.457 | 0.496 | 0.393 |
| 30.12.2022 | 0.389 | 0.433 | 0.336 |
| 29.12.2022 | 0.466 | 0.518 | 0.433 |
| 28.12.2022 | 0.571 | 0.634 | 0.518 |
| 27.12.2022 | 0.732 | 0.891 | 0.61 |
| 26.12.2022 | 0.598 | 0.708 | 0.518 |
| 25.12.2022 | 0.78 | 1.03 | 0.587 |
© Bayerisches Landesamt für Umwelt 2024