
- Start >
- Rivers >
- Discharge >
- Unterer Main >
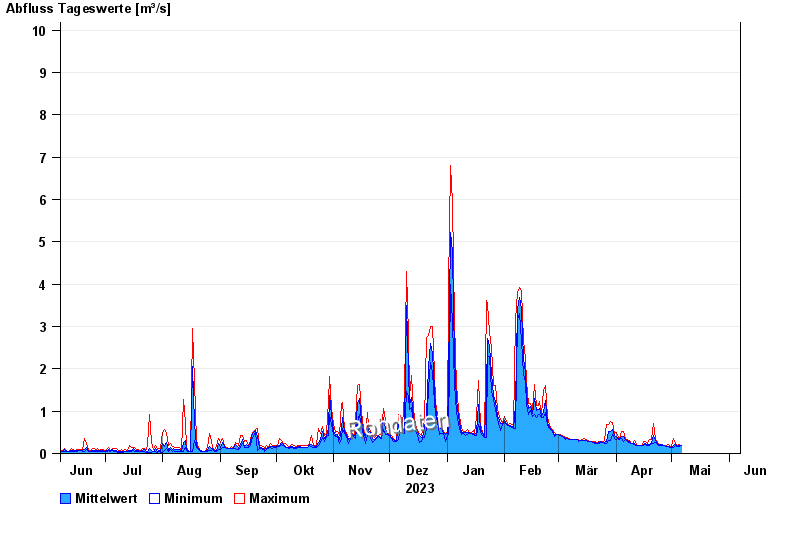
- Bad Königshofen im Grabfeld >
- Chart of year

Chart of year Bad Königshofen im Grabfeld / Fränkische Saale
Discharge from 07.06.2023 to 06.06.2024
note
Biberaktivität: Werte können durch Aufstau beeinflusst sein
- 07.05.1969 Abfluss: 20,9 m³/s
- 03.01.2003 Abfluss: 19,3 m³/s
- 24.12.1968 Abfluss: 16,6 m³/s
- 08.01.2011 Abfluss: 15,2 m³/s
- 23.02.1970 Abfluss: 15,1 m³/s
| Date | Mean value [m³/s] | Maximum [m³/s] | Minimum [m³/s] |
|---|---|---|---|
| 24.04.2024 | 0.227 | 0.227 | 0.227 |
| 23.04.2024 | 0.253 | 0.299 | 0.227 |
| 22.04.2024 | 0.296 | 0.339 | 0.262 |
| 21.04.2024 | 0.414 | 0.713 | 0.227 |
| 20.04.2024 | 0.266 | 0.339 | 0.227 |
| 19.04.2024 | 0.22 | 0.319 | 0.195 |
| 18.04.2024 | 0.207 | 0.227 | 0.195 |
© Bayerisches Landesamt für Umwelt 2024