
- Start >
- Rivers >
- Discharge >
- Unterer Main >
- Bad Königshofen im Grabfeld >
- Chart of year

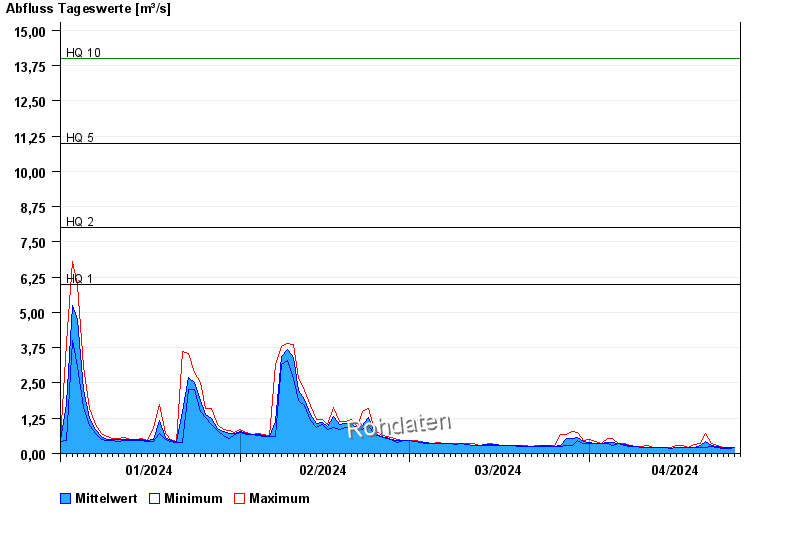
Chart of year Bad Königshofen im Grabfeld / Fränkische Saale
Discharge from 01.01.2024 to 26.04.2024
note
Biberaktivität: Werte können durch Aufstau beeinflusst sein
- HQ1 6 m³/s
- HQ2 8 m³/s
- HQ5 11 m³/s
- HQ10 14 m³/s
- HQ20 16 m³/s
- HQ50 18 m³/s
- HQ100 22 m³/s
| Date | Mean value [m³/s] | Maximum [m³/s] | Minimum [m³/s] |
|---|---|---|---|
| 26.04.2024 | 0.21 | 0.21 | 0.21 |
| 25.04.2024 | 0.201 | 0.21 | 0.18 |
| 24.04.2024 | 0.219 | 0.227 | 0.18 |
| 23.04.2024 | 0.253 | 0.299 | 0.227 |
| 22.04.2024 | 0.296 | 0.339 | 0.262 |
| 21.04.2024 | 0.414 | 0.713 | 0.227 |
| 20.04.2024 | 0.266 | 0.339 | 0.227 |
© Bayerisches Landesamt für Umwelt 2024