
- Start >
- Rivers >
- Discharge >
- Unterer Main >
- Atzhausen >
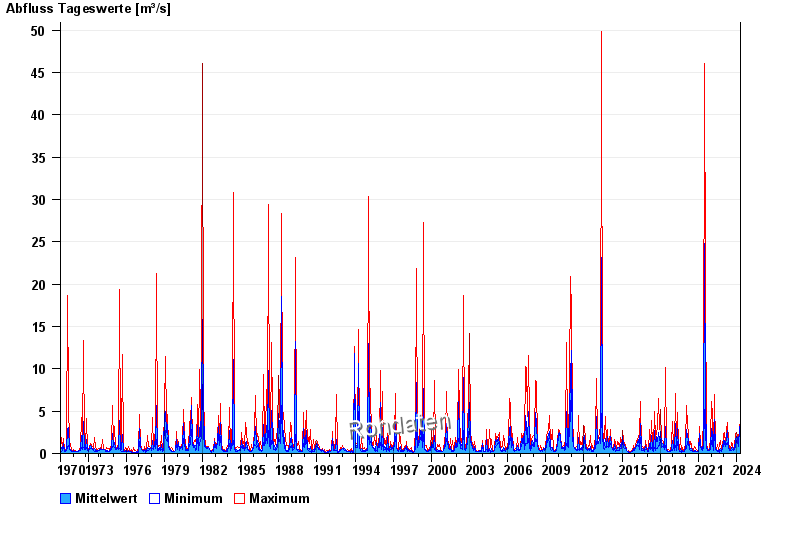
- Chart of total period

Chart of total period Atzhausen / Castellbach
Discharge from 01.11.1970 to 23.04.2024
| Date | Mean value [m³/s] | Maximum [m³/s] | Minimum [m³/s] |
|---|---|---|---|
| 23.04.2024 | 0.497 | 0.578 | 0.461 |
| 22.04.2024 | 0.675 | 0.853 | 0.578 |
| 21.04.2024 | 0.695 | 0.925 | 0.366 |
| 20.04.2024 | 0.437 | 0.487 | 0.366 |
| 19.04.2024 | 0.391 | 0.487 | 0.366 |
| 18.04.2024 | 0.386 | 0.411 | 0.366 |
| 17.04.2024 | 0.413 | 0.435 | 0.411 |
© Bayerisches Landesamt für Umwelt 2024