
- Start >
- Rivers >
- Discharge >
- Unterer Main >
- Arnstein >
- Chart of year

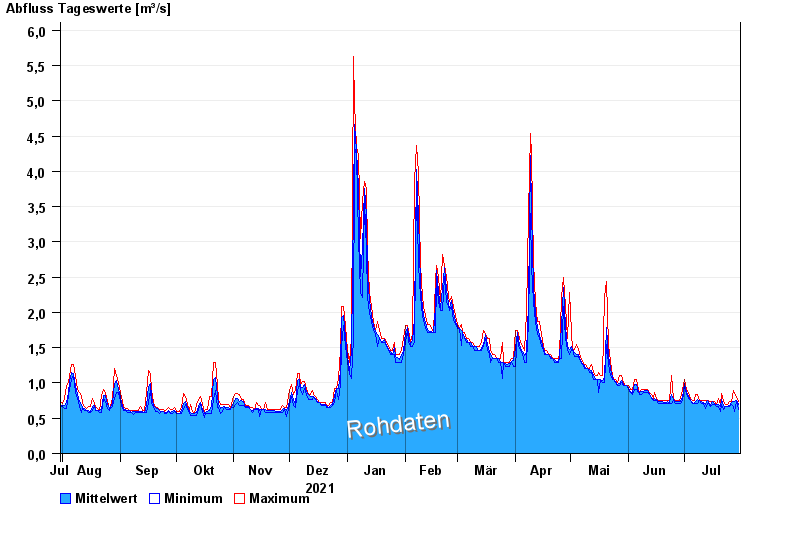
Chart of year Arnstein / Wern
Discharge from 31.07.2021 to 30.07.2022
| Date | Mean value [m³/s] | Maximum [m³/s] | Minimum [m³/s] |
|---|---|---|---|
| 30.07.2022 | 0.692 | 0.732 | 0.629 |
| 29.07.2022 | 0.753 | 0.812 | 0.732 |
| 28.07.2022 | 0.737 | 0.852 | 0.597 |
| 27.07.2022 | 0.734 | 0.898 | 0.662 |
| 26.07.2022 | 0.723 | 0.732 | 0.697 |
| 25.07.2022 | 0.682 | 0.732 | 0.662 |
| 24.07.2022 | 0.669 | 0.697 | 0.662 |
© Bayerisches Landesamt für Umwelt 2024