
- Start >
- Rivers >
- Discharge >
- Unterer Main >
- Arnstein >
- Chart of year

Chart of year Arnstein / Wern
Discharge from 26.01.2020 to 25.01.2021
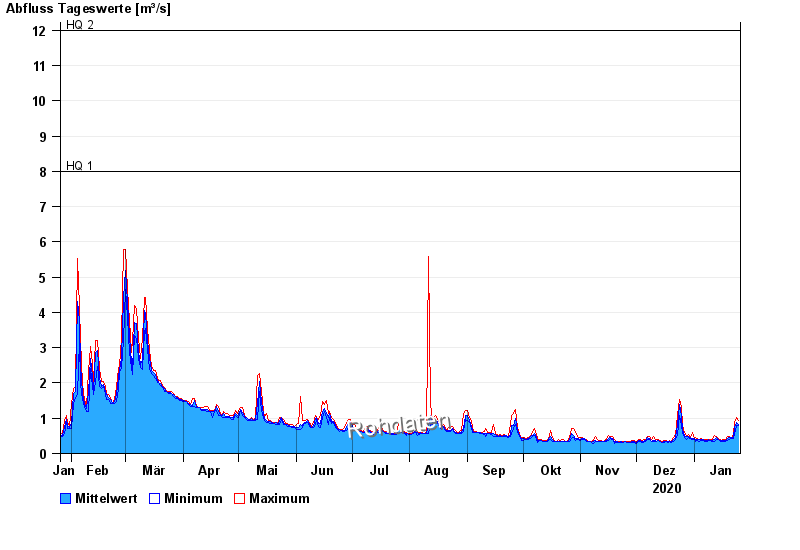
- HQ1 8 m³/s
- HQ2 12 m³/s
- HQ5 18 m³/s
- HQ10 22 m³/s
- HQ20 26 m³/s
- HQ50 32 m³/s
- HQ100 37 m³/s
| Date | Mean value [m³/s] | Maximum [m³/s] | Minimum [m³/s] |
|---|---|---|---|
| 25.01.2021 | 0.836 | 0.93 | 0.784 |
| 24.01.2021 | 0.868 | 1.03 | 0.784 |
| 23.01.2021 | 0.73 | 0.88 | 0.549 |
| 22.01.2021 | 0.467 | 0.549 | 0.433 |
| 21.01.2021 | 0.44 | 0.459 | 0.433 |
| 20.01.2021 | 0.448 | 0.486 | 0.408 |
| 19.01.2021 | 0.422 | 0.486 | 0.366 |
© Bayerisches Landesamt für Umwelt 2024