
- Start >
- Rivers >
- Discharge >
- Unterer Main >
- Arnstein >
- Chart of year

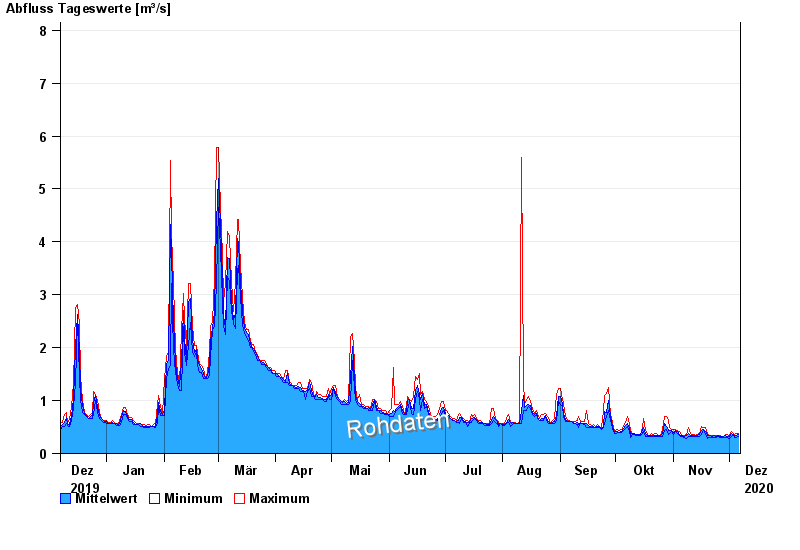
Chart of year Arnstein / Wern
Discharge from 07.12.2019 to 06.12.2020
- 26.01.1995 Abfluss: 26,7 m³/s
- 03.07.2009 Abfluss: 26,3 m³/s
- 01.06.2013 Abfluss: 24,3 m³/s
- 06.01.1982 Abfluss: 24,2 m³/s
- 03.01.2003 Abfluss: 23,6 m³/s
| Date | Mean value [m³/s] | Maximum [m³/s] | Minimum [m³/s] |
|---|---|---|---|
| 06.12.2020 | 0.356 | 0.387 | 0.327 |
| 05.12.2020 | 0.344 | 0.387 | 0.31 |
| 04.12.2020 | 0.333 | 0.366 | 0.31 |
| 03.12.2020 | 0.358 | 0.387 | 0.346 |
| 02.12.2020 | 0.37 | 0.408 | 0.327 |
| 01.12.2020 | 0.321 | 0.346 | 0.292 |
| 30.11.2020 | 0.327 | 0.366 | 0.31 |
© Bayerisches Landesamt für Umwelt 2024