
- Start >
- Rivers >
- Discharge >
- Unterer Main >
- Arnstein >
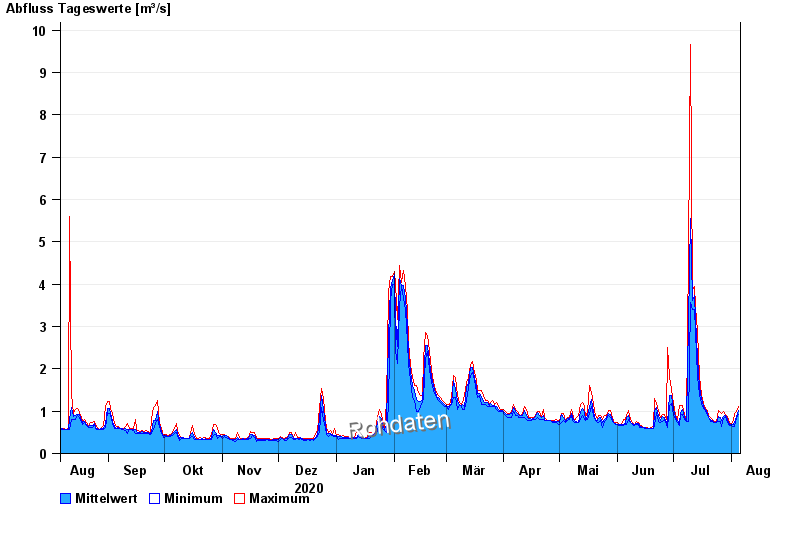
- Chart of year

Chart of year Arnstein / Wern
Discharge from 06.08.2020 to 05.08.2021
| Date | Mean value [m³/s] | Maximum [m³/s] | Minimum [m³/s] |
|---|---|---|---|
| 05.08.2021 | 1.02 | 1.1 | 0.91 |
| 04.08.2021 | 0.87 | 1 | 0.824 |
| 03.08.2021 | 0.725 | 0.953 | 0.639 |
| 02.08.2021 | 0.68 | 0.785 | 0.639 |
| 01.08.2021 | 0.678 | 0.707 | 0.673 |
| 31.07.2021 | 0.694 | 0.743 | 0.673 |
| 30.07.2021 | 0.794 | 0.863 | 0.743 |
© Bayerisches Landesamt für Umwelt 2024