
- Start >
- Rivers >
- Discharge >
- Unterer Main >
- Arnstein >
- Chart of year

Chart of year Arnstein / Wern
Discharge from 01.01.2024 to 31.12.2024
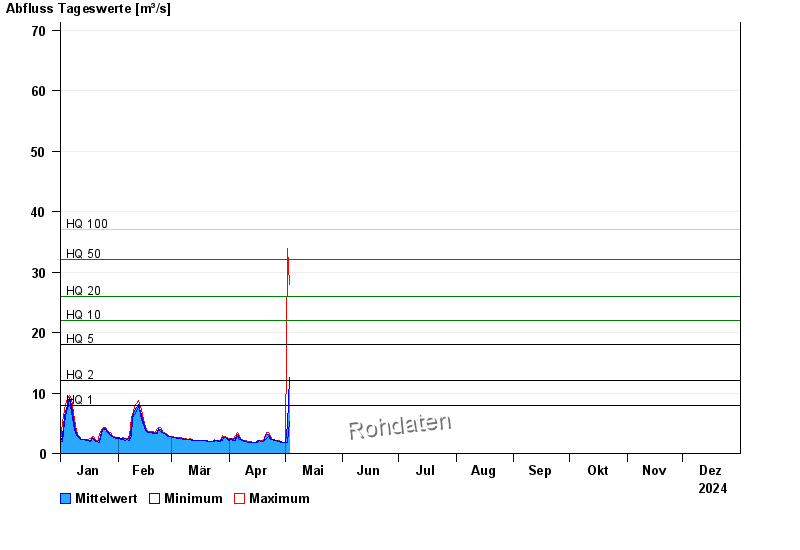
- HQ1 8 m³/s
- HQ2 12 m³/s
- HQ5 18 m³/s
- HQ10 22 m³/s
- HQ20 26 m³/s
- HQ50 32 m³/s
- HQ100 37 m³/s
| Date | Mean value [m³/s] | Maximum [m³/s] | Minimum [m³/s] |
|---|---|---|---|
| 23.04.2024 | 2.62 | 2.82 | 2.51 |
| 22.04.2024 | 3.16 | 3.41 | 2.82 |
| 21.04.2024 | 3.1 | 3.41 | 2.51 |
| 20.04.2024 | 2.43 | 2.66 | 2.22 |
| 19.04.2024 | 2.03 | 2.22 | 1.95 |
| 18.04.2024 | 2.06 | 2.16 | 2.02 |
| 17.04.2024 | 2.19 | 2.22 | 2.16 |
© Bayerisches Landesamt für Umwelt 2024