
- Start >
- Rivers >
- Discharge >
- Unterer Main >
- Arnstein >
- Chart of year

Chart of year Arnstein / Wern
Discharge from 01.01.2023 to 31.12.2023
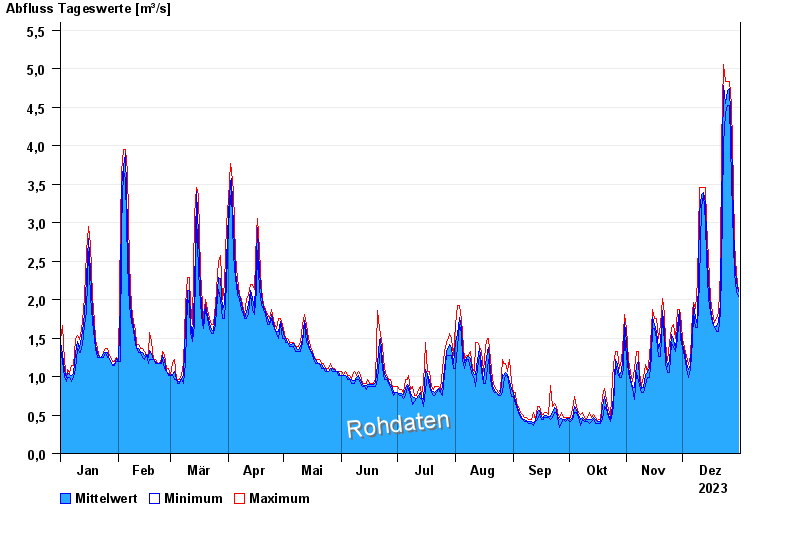
| Date | Mean value [m³/s] | Maximum [m³/s] | Minimum [m³/s] |
|---|---|---|---|
| 31.12.2023 | 2.1 | 2.11 | 2.04 |
| 30.12.2023 | 2.24 | 2.34 | 2.11 |
| 29.12.2023 | 2.51 | 2.73 | 2.34 |
| 28.12.2023 | 3.03 | 3.5 | 2.73 |
| 27.12.2023 | 4.09 | 4.52 | 3.55 |
| 26.12.2023 | 4.74 | 4.83 | 4.52 |
| 25.12.2023 | 4.72 | 4.83 | 4.52 |
© Bayerisches Landesamt für Umwelt 2024