
- Start >
- Rivers >
- Discharge >
- Unterer Main >
- Arnstein >
- Chart of year

Chart of year Arnstein / Wern
Discharge from 20.01.2020 to 19.01.2021
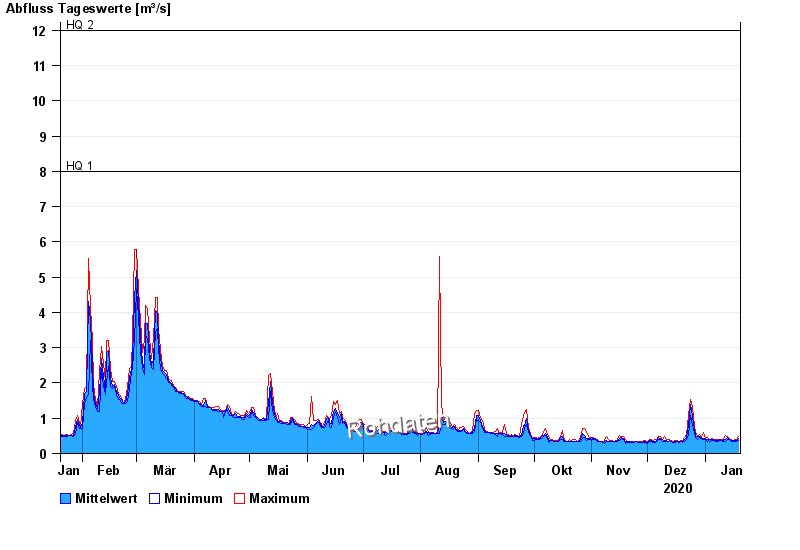
- HQ1 8 m³/s
- HQ2 12 m³/s
- HQ5 18 m³/s
- HQ10 22 m³/s
- HQ20 26 m³/s
- HQ50 32 m³/s
- HQ100 37 m³/s
| Date | Mean value [m³/s] | Maximum [m³/s] | Minimum [m³/s] |
|---|---|---|---|
| 19.01.2021 | 0.422 | 0.486 | 0.366 |
| 18.01.2021 | 0.375 | 0.408 | 0.346 |
| 17.01.2021 | 0.358 | 0.387 | 0.346 |
| 16.01.2021 | 0.36 | 0.366 | 0.346 |
| 15.01.2021 | 0.367 | 0.387 | 0.346 |
| 14.01.2021 | 0.404 | 0.433 | 0.387 |
| 13.01.2021 | 0.444 | 0.486 | 0.408 |
© Bayerisches Landesamt für Umwelt 2024