
- Start >
- Rivers >
- Discharge >
- Unterer Main >
- Arnstein >
- Chart of year

Chart of year Arnstein / Wern
Discharge from 07.07.2020 to 06.07.2021
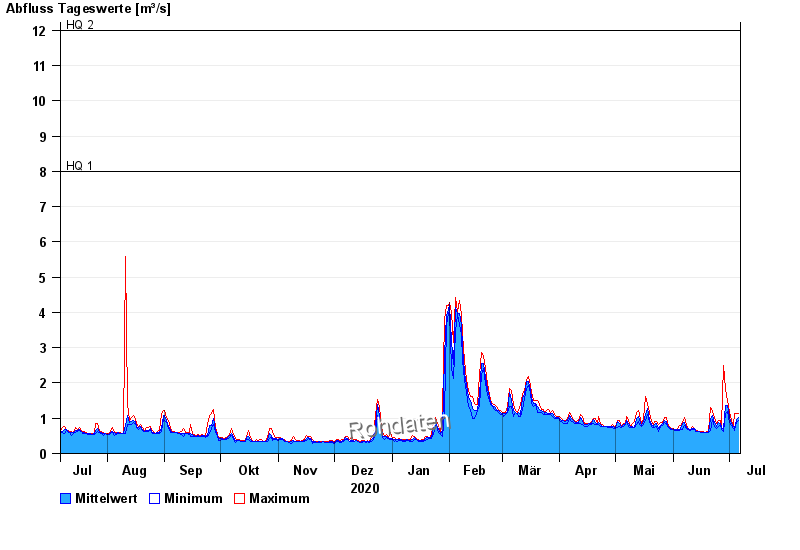
- HQ1 8 m³/s
- HQ2 12 m³/s
- HQ5 18 m³/s
- HQ10 22 m³/s
- HQ20 26 m³/s
- HQ50 32 m³/s
- HQ100 37 m³/s
| Date | Mean value [m³/s] | Maximum [m³/s] | Minimum [m³/s] |
|---|---|---|---|
| 06.07.2021 | 1.03 | 1.13 | 0.928 |
| 05.07.2021 | 0.973 | 1.13 | 0.886 |
| 04.07.2021 | 0.699 | 1.13 | 0.652 |
| 03.07.2021 | 0.771 | 0.801 | 0.721 |
| 02.07.2021 | 0.847 | 0.928 | 0.801 |
| 01.07.2021 | 1.03 | 1.18 | 0.886 |
| 30.06.2021 | 1.37 | 1.51 | 1.18 |
© Bayerisches Landesamt für Umwelt 2024