
- Start >
- Rivers >
- Discharge >
- Unterer Main >
- Arnstein >
- Chart of year

Chart of year Arnstein / Wern
Discharge from 01.01.2020 to 31.12.2020
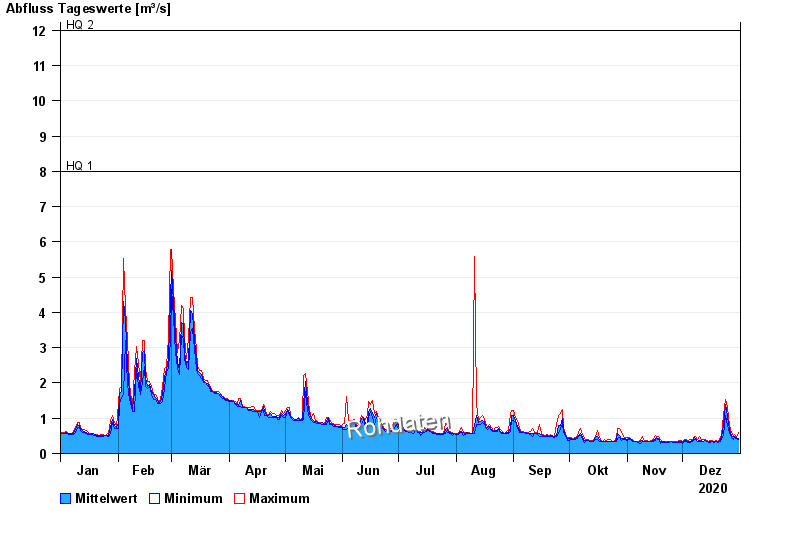
- HQ1 8 m³/s
- HQ2 12 m³/s
- HQ5 18 m³/s
- HQ10 22 m³/s
- HQ20 26 m³/s
- HQ50 32 m³/s
- HQ100 37 m³/s
| Date | Mean value [m³/s] | Maximum [m³/s] | Minimum [m³/s] |
|---|---|---|---|
| 31.12.2020 | 0.433 | 0.582 | 0.408 |
| 30.12.2020 | 0.45 | 0.459 | 0.433 |
| 29.12.2020 | 0.478 | 0.549 | 0.459 |
| 28.12.2020 | 0.472 | 0.486 | 0.408 |
| 27.12.2020 | 0.504 | 0.582 | 0.459 |
| 26.12.2020 | 0.679 | 0.784 | 0.582 |
| 25.12.2020 | 1.04 | 1.31 | 0.784 |
© Bayerisches Landesamt für Umwelt 2024