
- Start >
- Rivers >
- Discharge >
- Unterer Main >
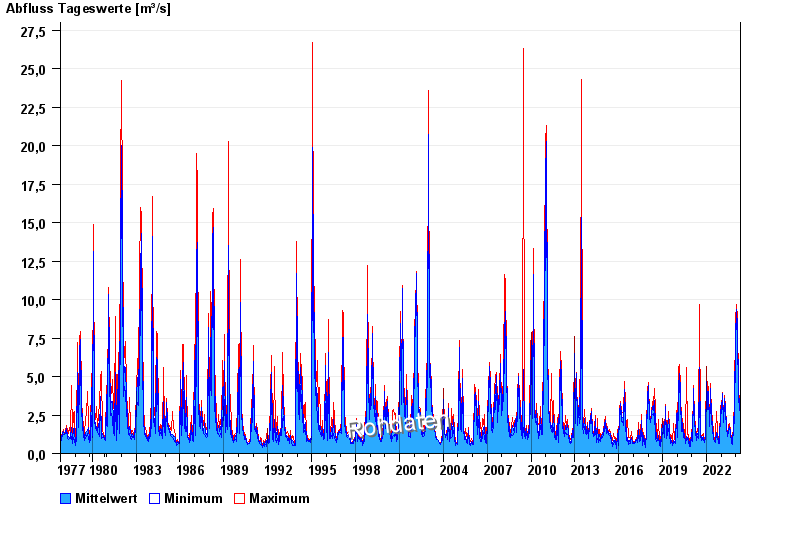
- Arnstein >
- Chart of total period

Chart of total period Arnstein / Wern
Discharge from 01.11.1977 to 25.04.2024
| Date | Mean value [m³/s] | Maximum [m³/s] | Minimum [m³/s] |
|---|---|---|---|
| 25.04.2024 | 2.31 | 2.36 | 2.29 |
| 24.04.2024 | 2.31 | 2.36 | 2.29 |
| 23.04.2024 | 2.55 | 2.82 | 2.36 |
| 22.04.2024 | 3.16 | 3.41 | 2.82 |
| 21.04.2024 | 3.1 | 3.41 | 2.51 |
| 20.04.2024 | 2.43 | 2.66 | 2.22 |
| 19.04.2024 | 2.03 | 2.22 | 1.95 |
© Bayerisches Landesamt für Umwelt 2024