
- Start >
- Rivers >
- Discharge >
- Obere Donau >
- Wittislingen >
- Chart of year

Chart of year Wittislingen / Egau
Discharge from 01.01.2024 to 24.04.2024
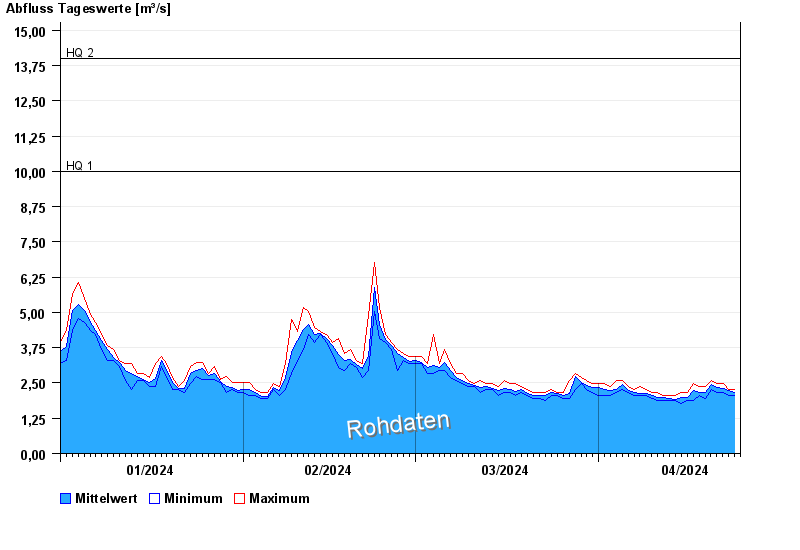
- HQ1 10 m³/s
- HQ2 14 m³/s
- HQ5 18 m³/s
- HQ10 21 m³/s
- HQ20 23 m³/s
- HQ50 26 m³/s
- HQ100 28 m³/s
| Date | Mean value [m³/s] | Maximum [m³/s] | Minimum [m³/s] |
|---|---|---|---|
| 24.04.2024 | 2.17 | 2.27 | 2.06 |
| 23.04.2024 | 2.22 | 2.27 | 2.06 |
| 22.04.2024 | 2.3 | 2.48 | 2.16 |
| 21.04.2024 | 2.34 | 2.48 | 2.16 |
| 20.04.2024 | 2.46 | 2.6 | 2.27 |
| 19.04.2024 | 2.17 | 2.38 | 1.96 |
| 18.04.2024 | 2.15 | 2.38 | 2.06 |
© Bayerisches Landesamt für Umwelt 2024