
- Start >
- Rivers >
- Discharge >
- Obere Donau >
- Weißenburg >
- Chart of year

Chart of year Weißenburg / Schwäbische Rezat
Discharge from 01.01.2024 to 25.04.2024
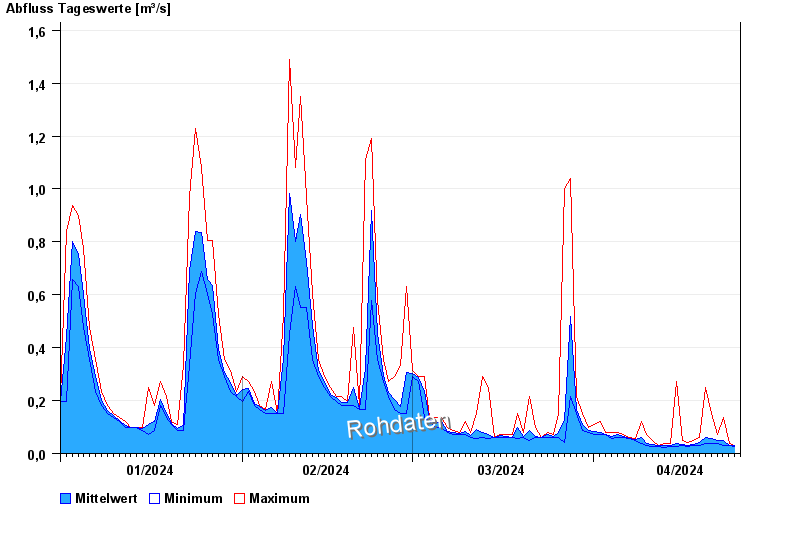
| Date | Mean value [m³/s] | Maximum [m³/s] | Minimum [m³/s] |
|---|---|---|---|
| 25.04.2024 | 0.031 | 0.031 | 0.031 |
| 24.04.2024 | 0.032 | 0.036 | 0.031 |
| 23.04.2024 | 0.05 | 0.136 | 0.031 |
| 22.04.2024 | 0.048 | 0.07 | 0.036 |
| 21.04.2024 | 0.057 | 0.15 | 0.036 |
| 20.04.2024 | 0.06 | 0.251 | 0.036 |
| 19.04.2024 | 0.041 | 0.062 | 0.031 |
© Bayerisches Landesamt für Umwelt 2024