
- Start >
- Rivers >
- Discharge >
- Obere Donau >
- Weißenburg >
- Chart of total period

Chart of total period Weißenburg / Schwäbische Rezat
Discharge from 01.11.1970 to 24.04.2024
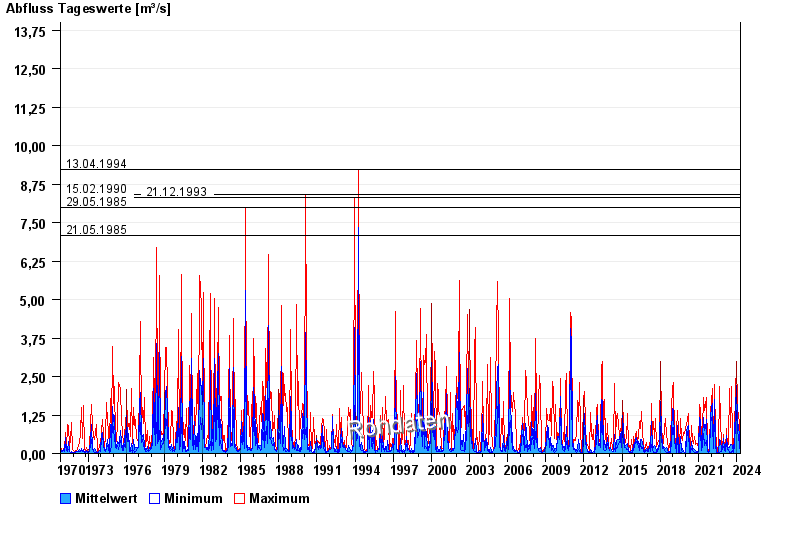
- 13.04.1994 Abfluss: 9,21 m³/s
- 15.02.1990 Abfluss: 8,42 m³/s
- 21.12.1993 Abfluss: 8,33 m³/s
- 29.05.1985 Abfluss: 8 m³/s
- 21.05.1985 Abfluss: 7,07 m³/s
| Date | Mean value [m³/s] | Maximum [m³/s] | Minimum [m³/s] |
|---|---|---|---|
| 24.04.2024 | 0.033 | 0.036 | 0.031 |
| 23.04.2024 | 0.05 | 0.136 | 0.031 |
| 22.04.2024 | 0.048 | 0.07 | 0.036 |
| 21.04.2024 | 0.057 | 0.15 | 0.036 |
| 20.04.2024 | 0.06 | 0.251 | 0.036 |
| 19.04.2024 | 0.041 | 0.062 | 0.031 |
| 18.04.2024 | 0.034 | 0.048 | 0.031 |
© Bayerisches Landesamt für Umwelt 2024