
- Start >
- Rivers >
- Discharge >
- Obere Donau >
- Weg >
- Chart of total period

Chart of total period Weg / Isen
Discharge from 01.11.1953 to 25.04.2024
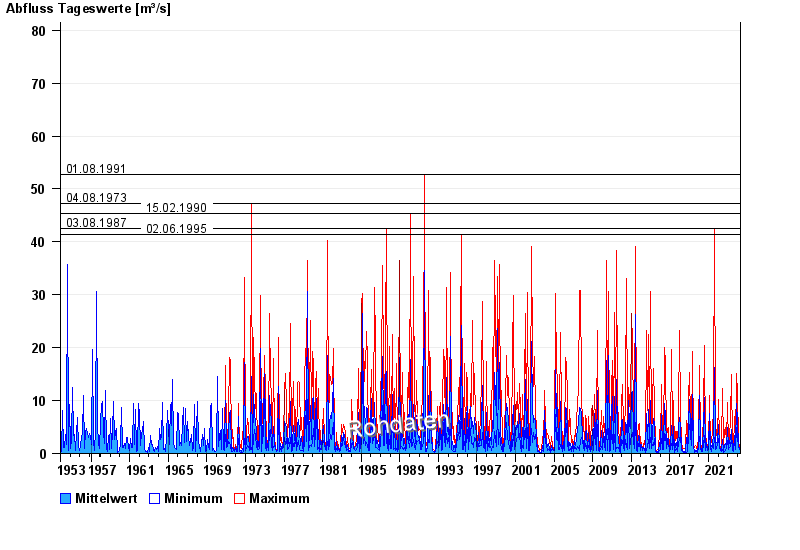
- 01.08.1991 Abfluss: 52,8 m³/s
- 04.08.1973 Abfluss: 47,2 m³/s
- 15.02.1990 Abfluss: 45,3 m³/s
- 03.08.1987 Abfluss: 42,6 m³/s
- 02.06.1995 Abfluss: 41,4 m³/s
| Date | Mean value [m³/s] | Maximum [m³/s] | Minimum [m³/s] |
|---|---|---|---|
| 25.04.2024 | 0.548 | 0.576 | 0.539 |
| 24.04.2024 | 0.587 | 0.615 | 0.539 |
| 23.04.2024 | 0.647 | 0.742 | 0.576 |
| 22.04.2024 | 0.993 | 1.31 | 0.742 |
| 21.04.2024 | 0.855 | 1.43 | 0.576 |
| 20.04.2024 | 0.506 | 0.615 | 0.441 |
| 19.04.2024 | 0.481 | 0.539 | 0.441 |
© Bayerisches Landesamt für Umwelt 2024